Many real-world problems require integrating multiple sources of information. Sometimes these problems involve multiple, distinct modalities of information — vision, language, audio, etc. — as is required to understand a scene in a movie or answer a question about an image. Other times, these problems involve multiple sources of the same kind of input, i.e. when summarizing several documents or drawing one image in the style of another.
Data Science Project Style Guide
Employers usually give a lot of weight to a candidate’s portfolio when hiring for a junior data science role. Although you may be capable of technically impressive projects, your job hunt will suffer if you don’t pay enough attention to the stylistic aspects as well. A busy employer is not going to review poorly constructed projects.
Design Patterns for Production NLP Systems
This post is an excerpt from the final chapter of our upcoming book on Deep Learning and NLP with PyTorch. The book is still a draft under review so your comments on this section are appreciated!
I think they use witchcraft
Hello Dr. Andrew Gelman,
Divisibility in statistics: Where is it needed?
| The basics of Bayesian inference is p(parameters | data) proportional to p(parameters)*p(data | parameters). And, for predictions, p(predictions | data) = integral_parameters p(predictions | parameters,data)*p(parameters | data). |
Lenny Dykstra, His Strike Zone, & Bayesian Stats
In 2015, former Major Leaguer Lenny Dykstra went on Colin Cowherd’s radio show and claimed that he used to hire private investigators to find dirt on umpires. The intention of doing so was to turn that dirt into a more favorable strike zone for himself. You can find the clip here.
Speed up your R Work
In this note we will show how to speed up work in R by partitioning data and process-level parallelization. We will show the technique with three different R packages: rqdatatable, data.table, and dplyr. The methods shown will also work with base-R and other packages.
He wants to know what to read and what software to learn, to increase his ability to think about quantitative methods in social science
A law student writes:
From the Sidewalk to the Saddle: Data and the Tour de France
As the third largest sporting event, it’s no wonder that the Tour de France (which kicks off July 7th) has engaged in the data revolution. The goal is to offer real-time insights to the estimated 1.3 billion viewers who follow the race to the Champs Elysées. But it’s no easy task.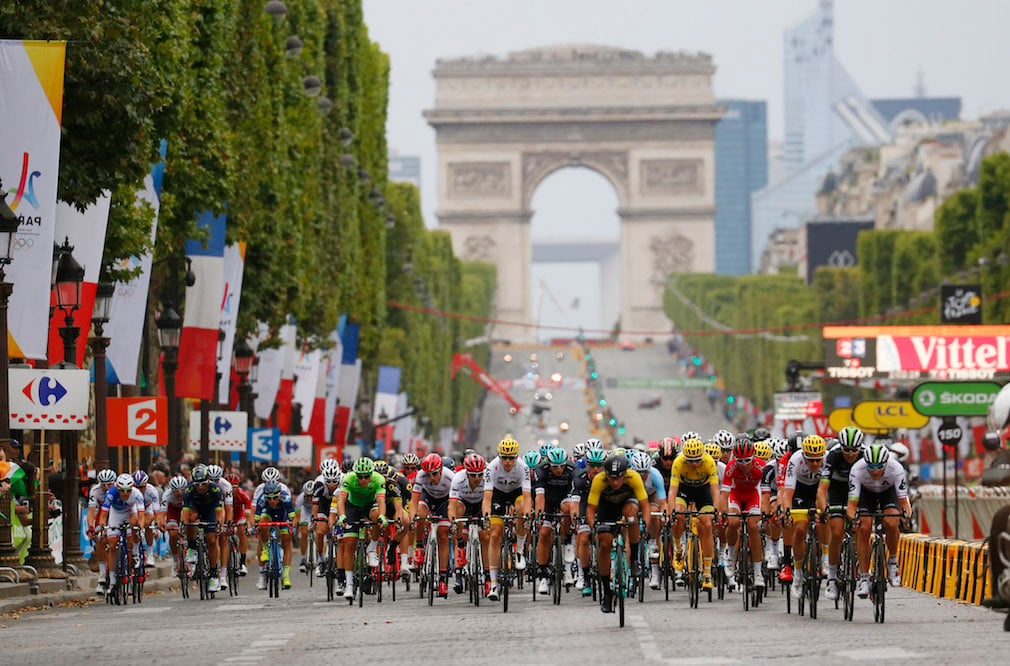 The move into the world of data in cycling was delayed compared to most other sports, in which the action happens in a single venue. The Tour has 21 stages, 198 riders crossing and overcrossing over 3,500+ km, and a winner determined in the most revered and hostile natural environments.
FIFA WC 2018: Quarter Final Stage Preditions
One of the most popular and most viewed soccer events is going on in Russia with 32 teams participating. FIFA World Cup 2018 is a global event filled with lot of action and tons of emotions. It’s like crazy madness that comes every four years and involves people from around the world. Let us look at some of the developments so far: