As the third largest sporting event, it’s no wonder that the Tour de France (which kicks off July 7th) has engaged in the data revolution. The goal is to offer real-time insights to the estimated 1.3 billion viewers who follow the race to the Champs Elysées. But it’s no easy task.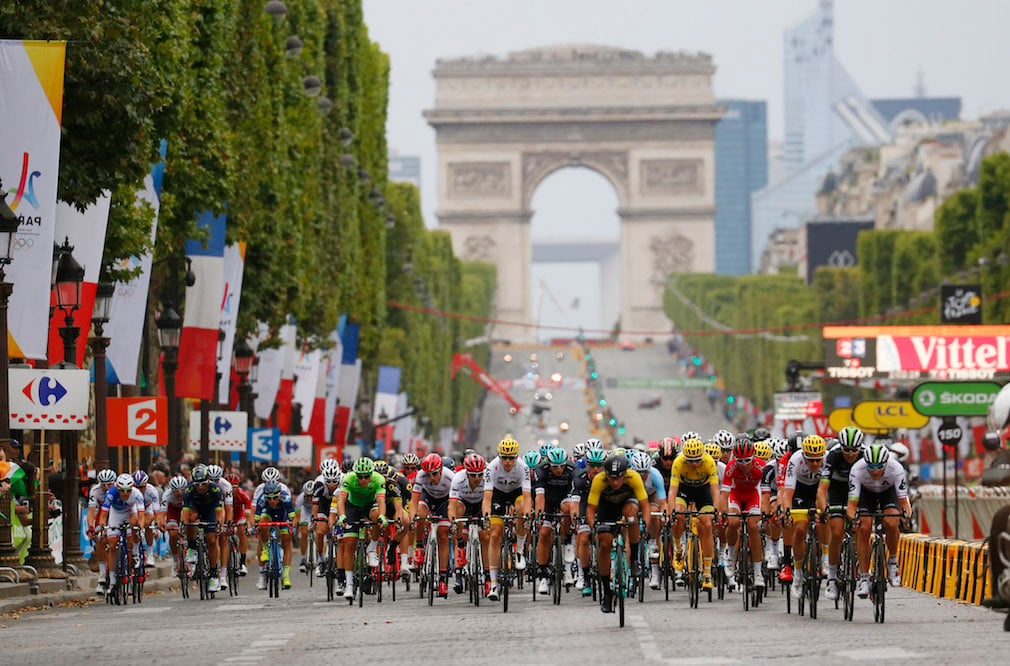 The move into the world of data in cycling was delayed compared to most other sports, in which the action happens in a single venue. The Tour has 21 stages, 198 riders crossing and overcrossing over 3,500+ km, and a winner determined in the most revered and hostile natural environments.
It’s fair to say that the challenge in using the data from the Tour is comparable to getting the yellow jersey: you need to harness some of nature’s greatest heights (and it takes teamwork to keep it).
Relaying data from bikes to TV viewers in seconds
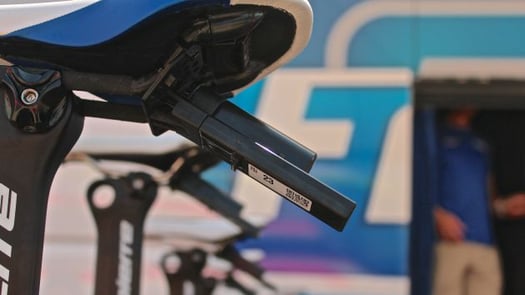
Let’s dig into the mechanics. Data is sourced using a small, 100-gram sensor, which is attached under the saddle of every rider. It contains a GPS receiver, a radio frequency transmitter, and a battery, which the teams are responsible for recharging every other day.
The device connects via line of sight to one of the TV helicopters or aircrafts following the race, using radio frequency. All of the transmitters create a WWAN (Wireless Wide Area Network) mesh network, which means that they are all interconnected, as well as with race motorcycles and cars, and can transmit data feeds on behalf of others to ensure consistent coverage despite harsh conditions.
Signals are then transmitted to an aircraft further above, which relays them to the TV trucks at the stage finish. The data is eventually split from the TV feed and reaches its final destination in Dimension Data’s truck, also waiting at the finish line. Each sensors transmits its GPS position every second, which in 2017 represented 147 GB of data across 3 billion data points.
The road from analytics to prediction
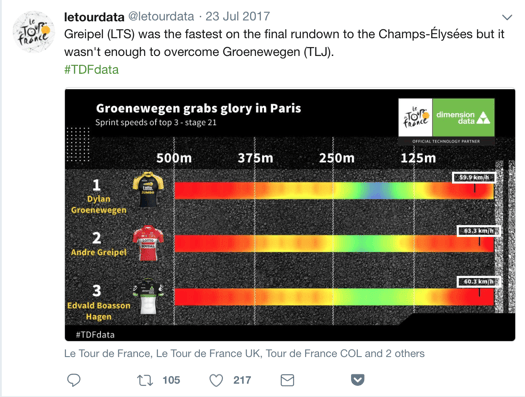
The official goal is to offer more insights into the race, such as precise time to finish, live speed, and the riders distribution, which are broadcasted as inlays on TV screens. The data also generates visualization tools to feed the Tour’s data website (Race Centre), and social media (@letourdata).
The data is combined with other sources, such as weather conditions, road gradients, and historic data to provide commentators with relevant info to tell the narrative of the century-old race.
Cycling fans can certainly expect many more improvements to keep their summer entertained. A few GoPro cameras are disseminated in the peloton to provide a closer view of the action (if you like scary movies, you can watch stage highlights like this one, as many of them unfortunately involve massive crashes). Weight and connectivity are likely to improve in coming years, enabling wider usage.
But capturing and combining data isn’t even the biggest challenge. Predicting outcomes is tricky business, even with lots and lots of data (as you can see from our failed prediction for who would win the 2018 FIFA World Cup). Many factors are at play here: rider form, historical performance, rider profile vs. stage type, form of other riders, team composition, team form, etc.
And as any cycling fan knows, circumstances play a big role in the sport. Whatever technological advances there may be, July will remain an exciting month on French roads and beyond.
If that article made you hungry for more industries where IoT brings new insights, check out our white paper on how and why it’s shifting enterprise AI strategy (and what gains to expect).
