It is time for another yearly update of the publication statistics in Machine Learning and Natural Language Processing. The field has continued to grow very rapidly, both in number of publications and number of attendees, breaking all sorts of previous records. Perhaps most notably the initial release of NeurIPS conference tickets sold out in 11 minutes and 38 seconds. In this post I will provide some finer-grained statistics on these numbers, showing which authors and organizations are publishing most at specific conferences.
This year, I have included the following conferences/journals: ACL, EMNLP, NAACL, EACL, COLING, TACL, CL, CoNLL, NeurIPS, ICML, ICLR, AAAI. This selection aims to cover the most well-known and high-ranking venues for publishing work on both machine learning and language technologies. Compared to last year, I’ve removed SemEval, as it has a large focus on shared task papers and I’m not including these for other conferences either. I’ve also added AAAI, which is one of the bigger conferences and was previously missing from the rankings. NeurIPS (previously known as NIPS) changed its name this year, but for consistency I will use the new name to refer to all the previous iterations as well.
This analysis is done automatically with a collection of scripts that I’ve continued to improve over the years. The paper lists are crawled from online proceedings and author names can usually be found there as well. Organization names need to be extracted straight from the PDFs which can lead to quite a bit of noise. I’ve created various methods for detecting and mapping different types of names, but let me know if you spot any remaining errors.
While this post highlights authors and organizations who have published the most in the recent year, I want to specify that I do not think that publication quantity is something that we as a field should be pursuing or rewarding. As the graphs below show, the field is becoming more and more popular, and this rapid increase in numbers comes with very varying quality. Authoring 1 piece of groundbreaking work is always better than releasing 10 totally forgettable incremental papers. This post is just meant to give a light high-level view of who is currently publishing and at which conferences, and perhaps provide a bit of inspiration for new researchers with great ideas.
Venues
We start off by looking at the publications at all the conferences between 2012-2018. Most of the ML venues continued their growth in the number of published papers, with AAAI and NeurIPS going past the 1,000 paper mark. EMNLP and NAACL also had their record years by quite a margin, whereas ACL and COLING stayed closer to the previous numbers. EACL took this year to rest, and the number of papers in TACL and CL has remained relatively stable throughout the years.
Authors
Next up, we can look at individual authors who have published most papers in these conferences during 2018. Three researchers have each contributed to an impressive 22 papers: Ming Zhou (Microsoft), Graham Neubig (Carnegie Mellon) and Sergey Levine (UC Berkeley). They are closely followed by Tong Zhang (Tencent AI, up until very recently), Maosong Sun (Tsinghua University) and Iryna Gurevych (TU Darmstadt).
Looking at the total number of publications between 2012-2018, Chris Dyer (DeepMind) is still at the top with 97. He is followed by Ming Zhou (Microsoft), Yoshua Bengio (Montréal), Yue Zhang (Westlake) and Noah A. Smith (Washington). Most authors have a clear preference either towards the NLP or core-ML conferences, with Percy Liang perhaps being the exception that has an equal balance across both areas.
We can also look at the number of papers from each author across different years. The massive 2-year publishing spike by Chris Dyer is still standing out compared to others, although Yue Zhang and Ming Zhou have come close.
First Authors
Next, let’s look at the statistics regarding first authors. While the previous section includes mostly group leaders, the first authors on publications are usually the ones who do the practical implementation, run the experiments and write large parts of the paper. The very clear leader in this category is Yi Tay (Nanyang Technological University), a 3rd year PhD student who managed to publish an impressive 10 papers at main conferences in 2018. With still a very respectable 6 publications is Zeyuan Allen-Zhu (MSR). Following them, Mikel Artetxe, Jiatao Gu (University of Hong Kong), Dinghan Shen (Duke University) and Nathan Kallus (Cornell University) each had 5 first-author papers last year.
Looking at the whole period, Jiwei Li (Shannon.AI) has built up an impressive 22 first-author publications. He is followed by Zeyuan Allen-Zhu (MSR), Young-Bum Kim (Amazon), Ryan Cotterell (Cambridge) and Ivan Vulić (Cambridge).
Organizations
Next, let’s look at the statistics of organizations. As with the previous two years, CMU again took the lead in 2018, with a relatively even spread between NLP and core ML. Google and Microsoft are still the industry leaders, with Tsinghua, Stanford, Peking, MIT and Berkeley forming the rest of the top publishing organizations.
Looking at the whole period between 2012-2018, the ranking is relatively similar. CMU is again firmly in the lead, with Microsoft and Google having switched places for the next two positions. Princeton, INRIA and Duke seem to focus only on core ML, without almost any publishing in the NLP area. In contrast, Peking, CAS and Edinburgh seem to have a very strong emphasis on language applications over publishing in NeurIPS/ICML.
Looking at the timeline, we can see that CMU has been maintaining a large publication output for several years already and still continues to grow. Google and Microsoft have battled it out but Google seems to have taken the lead for now. Chinese universities like Tsinghua and Peking are currently going through a very sharp rise in publication numbers.
Topic Clustering
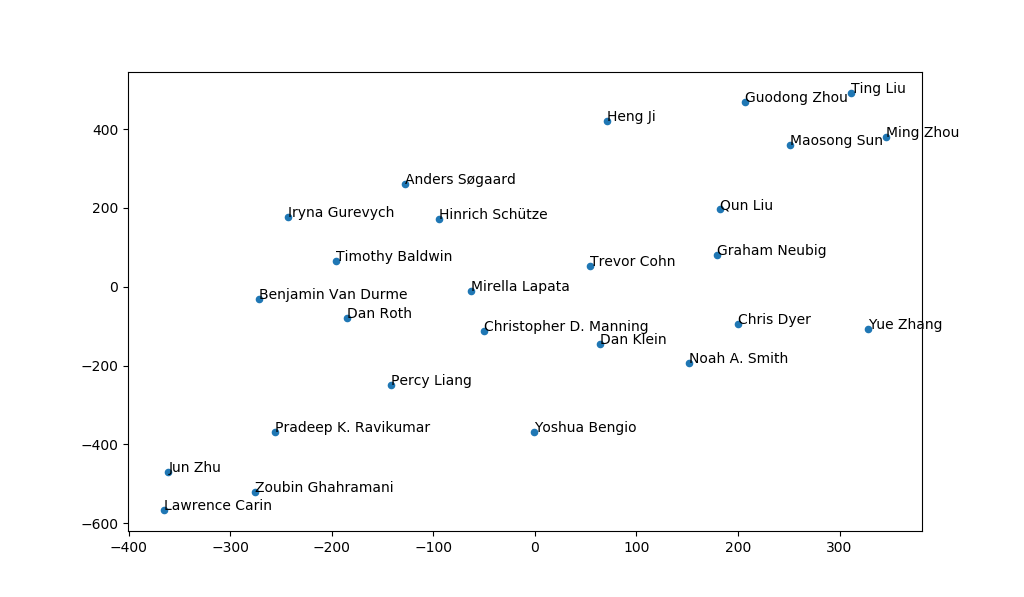
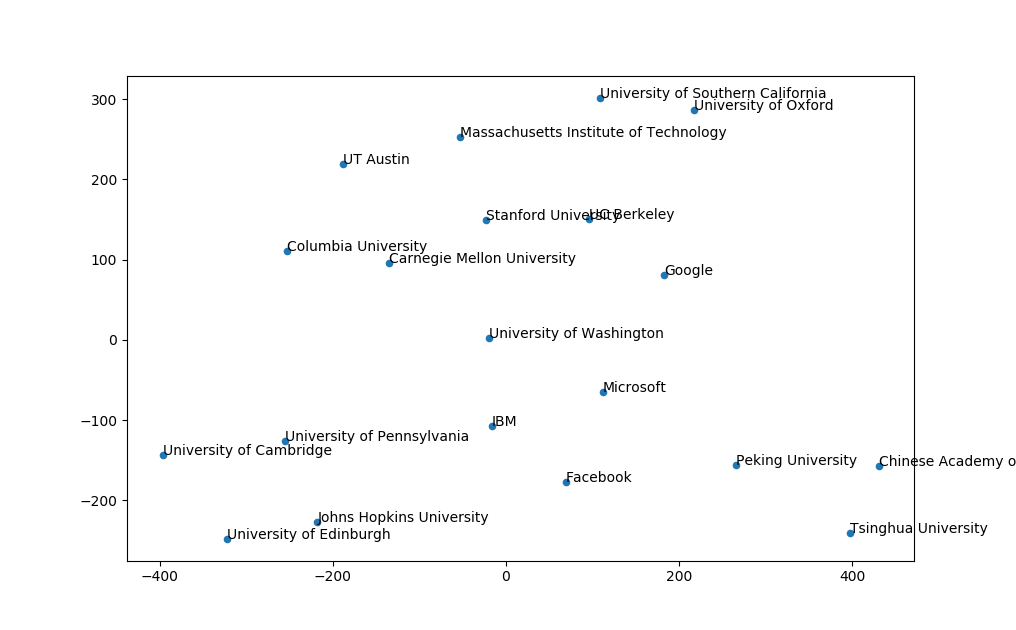
Finally, I ran some topic clustering on authors and organizations. I collected all the publications that were associated to that specific authot/organization, lowercased and tokenized them, passed them through LDA and then visualized with t-SNE. It acts as a nice visualization of the top publishing entities, showing how similar their paper content is to the others in the graph.


That’s all for this year. If you notice any mistakes, or if you have suggestions for next year, let me know by leaving a comment or sending me an email.
I hope everyone has a great 2019, both professionally and personally!