The truth is out there R readers, but often it is not what we have been led to believe. The previous post examined the strong positive results bias in optimism corrected bootstrapping (a method of assessing a machine learning model’s predictive power) with increasing p (completely random features). There were 2 implementations of the method given, 1 has a slight error, 2 seems fine. The trend is still the same with the corrected code, but the problem with my code is I did not set ‘replace=TRUE’ in the call to the ‘sample’ function.
Thanks to ECOQUANT for pointing out the error.
Let’s just recap what bootstrapping is and what optimism corrected bootstrapping is before we redo the experiments:
This is from Jason’s excellent blog (https://machinelearningmastery.com/a-gentle-introduction-to-the-bootstrap-method/), bootstrapping is:
-
Choose a number of bootstrap samples to perform
-
Choose a sample size
For each bootstrap sample (b=1 … B)
-
Draw a sample with replacement with the chosen size
-
Calculate the statistic on the sample
The with replacement part means we have to put each individual sample back when getting our sample in the bth bootstrap iteration. Thus, we usually have duplicate samples in our sample of the data when doing bootstrapping.
This is the optimism corrected bootstrapping algorithm:
- Fit a model M to entire data S and estimate predictive ability C.
Iterate from b=1…B:
-
Take a resample from the original data, S*
-
Fit the bootstrap model M* to S* and get predictive ability, C_boot
-
Use the bootstrap model M* to get predictive ability on S, C_orig
Since we use the same data in step 3 of the bootstrap to train and test the model (an information leak), we would expect increasing bias (C_orig should be too high, thus O too small) when more and more random features are added. See the previous post for more explanation on this. Another point is, the optimism corrected bootstrap is done with a sample size of N instead of just a fraction of N, usually. I found the following quote to support this:
“The small data set was repeatedly re-sampled to produce b replicated data sets, each the same size as the original. We used b = 200. The predictive model was fitted to each ofthe b replicated data sets in turn. Each fitted model was then applied both to the resampled data set from which it was generated and to the original data set.”
Smith, Gordon CS, et al. “Correcting for optimistic prediction in small data sets.” American journal of epidemiology 180.3 (2014): 318-324.
I have tried reducing the re-sampling size, which reduces the bias somewhat, but it is still there. This makes sense due to the information leak in this method which results in an under estimation of the optimism (O).
Your welcome to experiment with this code yourselves.
This code can be directly copied and pasted into R to repeat the experiments.
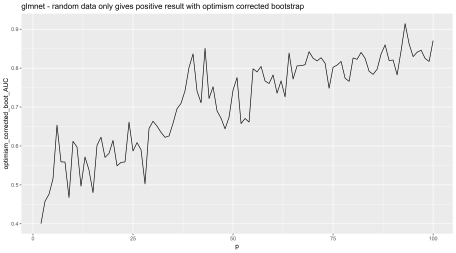
Experiment 1: my implementation – glmnet (lasso logistic regression)
Here are the results with 100 samples and 50 bootstrap iterations from 2 to 100 random features from a Gaussian distribution. We are re-sampling using the original sample size (N=100).
Random features are being added iteratively on the X axis, and on the Y, we have AUC. The AUC should be 0.5 to reflect the data has no real predictive power, but it is highly inflated.
Experiment 2: another implementation – glm (logistic regression)

Related