Recently I wanted to learn how to use emojis as points in a scatterplot points. It seems like the emojifont package is a popular way to do it. However, I couldn’t seem to get it to work on my machine (perhaps I need to install the font manually?). The other package I found was emoGG; this post shows how to use this package. (For another example involving fire stations, see this script.)
Let’s load the packages:
Let’s load a less commonly used small dataset that comes with base R called ToothGrowth:
Here is the dataset’s description from its documentation:
The response is the length of odontoblasts (cells responsible for tooth growth) in 60 guinea pigs. Each animal received one of three dose levels of vitamin C (0.5, 1, and 2 mg/day) by one of two delivery methods, orange juice or ascorbic acid (a form of vitamin C and coded as
VC).
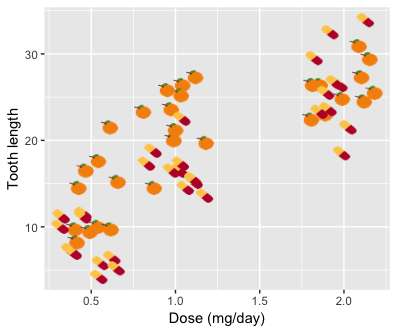
A little esoteric… but it’ll work for our purposes. Let’s make a scatterplot of len vs. dose:

To plot emojis instead of points, we use the geom_emoji layer and specify which emoji to use with the emoji option:

We can add horizontal jitter to the points manually:

I wasn’t able to find an elegant way to have different emojis printed for different points. For example, this dataset contains 30 guinea pigs fed by orange juice and 30 fed by ascorbic acid: we might want different emojis to represent these two groups. The following code does not work:
What we could do is add separate layers manually for each of the 30 guinea pigs. It’s cumbersome but it works…
How did I find the emoji code to use? emoGG comes with an emoji_search function that helps us with that. For example, to find the code for the orange emoji:
Related