Newsletter ** Privacy Contact Us ** About

This is a classic case of making sure you read the question fully, and then answering the correct problem! When I first saw this question, I was guilty of this transgression. I answered the wrong question, and got the incorrect answer. My confession follows, but first the question:
Read the question first!

The problem

It’s a few days before Christmas, and there are still toys to be made. 1,000 elves are available, and this is the perfect number to finish the task, on schedule. However, after the first quarter of the work is complete, 100 elves get sick and can no longer work. The second quarter of the task is completed behind schedule. Then, an additional 100 elves get sick, so the third quarter of work is completed behind schedule. Given that all elves work at the same rate, what is the minimum number of additional elves, to be added to the 800 workers still on the job, by Santa, to complete the task on schedule, or before?
Confession
When I first read this problem, I fell in the classic trap of these rate-style puzzles and assumed that the denominators were constant. Quickly (mis)reading the words, I assumed that quarters referred to fixed durations of time. Paraphrasing an old teacher, *“Average speed is not the average of speeds”. *
Based on this false assumption, the puzzle seemed pretty easy:
In the first quarter, 25% of the work is completed. In the second quarter 900/1000 × 25% = 22.5% of the work is completed. In the third, 800/1000 × 25% = 20%. So, after three quarters, 25%+22.5%+20% = 67.5% of the work is complete, leaving 32.5% of the work remaining. The number of elves required to do this work is (32.5/25) × 1000 = 1,300. As there are already 800 on the job, Santa needs to recruit an additional 500 elves.
This seems to make sense, as each elf can make a fixed number of toys in a fixed period of time, and we’re missing 300 elf-days of work from those who dropped out after the first quarter, and 200 elf-days of work from those who dropped out half-way. We just add these into the last quarter.
This, however, is wrong. As we’ve hinted above, the time periods are not constant. If you read the question carefully, after the first 100 elves drop out, those still on the job continue on to complete the second quarter of the task, but “behind schedule”. Likewise, the third quarter of the work slides out. A quarter is finished when that percentage of the task is complete, not when one quarter of the time is over.

Another example to show this point: If you need to drive to Grandmas house, which is 60 miles away, and you normally drive at an average speed of 60 mph, it will take you an hour. If, because of traffic, when you reach half way, you see you’ve only averaged 30 mph, how fast do you have to drive, on average, on the second half to make it to Grandma’s house on time?
Solution
Let’s look at the correct solution to this puzzle.
Let each elf’s work rate be e, and the entire time for the tasks to be t. We’ll define the total amount of work to be complete as one unit.
With 1,000 eleves the entire task can be finished. The first quarter of the task takes a quarter of the time.

The second quarter of the tasks only has 900 elves. We can describe the time this takes to be tq2, and substituting this gives an equation for how long this will take.

Similarly for tq3.

Adding up the times for q1, q2, q3, the balance is the time needed for q4, and we can calculate this.

Finally substituting in e from the first equation, and adding the additional elves N needed to make the final 1/4
We see that we need an additional 765.2 elves. As elves are quantized and (probably) not available in partial quantities, we need to round this up (take the ceiling), to give the answer that Santa needs to find an additional 766 elves.
Below is the data plotted as a Gantt type chart showing what percentage of time is spent in each ‘quarter’. For reference, below are the 25% equal time marks.
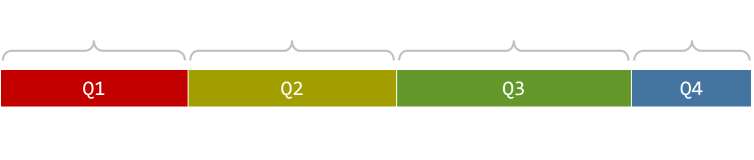
There’s probably a project management moral here about what to do if you are in charge of a project and some of your employees get sick. You can elect to slip the milestones, or adjust the functionality in the intermediate deliverables. Both have different consequences with resources needed if you want to catch up and still meet the same delivery date after you deliver what you consider to be the Q3 deliverable. It’s still the same amount of work to complete the project, it’s just about whether you are adjusting the time between intermediate milestones to keep the same functionality, or doing as much as you can in each milestone with the resources you have. If you do the latter, you’ll need more warm bodies in the last ‘quarter’ as this is shorter.
Below is the data shown in tabular form. The columns show the percentage of total production and time spent in each ‘quarter’. On the left side are the tasks when split so that the production time is constant. On the right, so that production quantity is constant.
Fixed Quarter Times
| Quarter | # Elves | Production | Time | —— |
| Q1 | 1,000 | 25.00% | 25.00% | |
| Q2 | 900 | 22.50% | 25.00% | |
| Q3 | 800 | 20.00% | 25.00% | |
| Q4 | 1,300 | 32.50% | 25.00% |
Fixed Production Quantity
| Quarter | # Elves | Production | Time | —— |
| Q1 | 1,000 | 25.00% | 25.00% | |
| Q2 | 900 | 25.00% | 27.78% | |
| Q3 | 800 | 25.00% | 31.25% | |
| Q4 | 1,565.22 | 25.00% | 15.97% |
The number of elves in Q4 is different because the time spent in the last ‘quarter’ is different in each case, but it’s the same amount of total work.