The constant evolution of technology has meant data and information is being generated at a rate unlike ever before, and it’s only on the rise. Furthermore, the demand for people skilled in analyzing, interpreting and using this data is already high and is set to grow exponentially over the coming years. These new roles cover all aspect from strategy, operations to governance. Hence, the current and future demand will require more data scientists, data engineers, data strategists, and Chief Data Officers.
In this blog, we will be looking at different set of interview questions that can certainly help if you are planning to give a shift to your career towards data science.
Statistics
1. Name and explain few methods/techniques used in Statistics for analyzing the data?
Answer:
Arithmetic Mean:It is an important technique in statistics Arithmetic Mean can also be called an average. It is the number or the quantity obtained by summing two or more numbers/variables and then dividing the sum by the number of numbers/variables.
Median:Median is also a way of finding the average of a group of data points. It’s the middle number of a set of numbers. There are two possibilities, the data points can be an odd number group or it can be en even number group.If the group is odd, arrange the numbers in the group from smallest to largest. The median will be the one which is exactly sitting in the middle, with an equal number on either side of it. If the group is even, arrange the numbers in order and pick the two middle numbers and add them then divide by 2. It will be the median number of that set.
Mode:The mode is also one of the types for finding the average. A mode is a number, which occurs most frequently in a group of numbers. Some series might not have any mode; some might have two modes which is called bimodal series.
In the study of statistics, the three most common ‘averages’ in statistics are Mean, Median and Mode.
Standard Deviation (Sigma):Standard Deviation is a measure of how much your data is spread out in statistics.
Regression:Regression is an analysis in statistical modelling. It’s a statistical process for measuring the relationships among the variables; it determines the strength of the relationship between one variable and a series of other changing independent variables.
2. Explain about statistics branches?
Answer:The two main branches of statistics are descriptive statistics and inferential statistics.
Descriptive statistics: Descriptive statistics summarizes the data from a sample using indexes such as mean or standard deviation.
Descriptive Statistics, methods include displaying, organizing and describing the data.
Inferential Statistics: Inferential Statistics draws the conclusions from data that are subject to random variation such as observation errors and sample variation.
3. List all the other models work with statistics to analyze the data?
Answer:Statistics along with Data Analytics analyzes the data and help business to make good decisions. Predictive ‘Analytics’ and ‘Statistics’ are useful to analyze current data and historical data to make predictions about future events.
4. List the fields, where statistic can be used?
Answer:Statistics can be used in many research fields. Below are the lists of files in which statistics can be used
-
Science
-
Technology
-
Business
-
Biology
-
Computer Science
-
Chemistry
-
It aids in decision making
-
Provides comparison
-
Explains action that has taken place
-
Predict the future outcome
-
Estimate of unknown quantities.
5. What is a linear regression in statistics?
Answer:Linear regression is one of the statistical techniques used in a predictive analysis, in this technique will identify the strength of the impact that the independent variables show on deepened variables.
6. What is a Sample in Statistics and list the sampling methods?
Answer:In a Statistical study, a Sample is nothing but a set of or a portion of collected or processed data from a statistical population by a structured and defined procedure and the elements within the sample are known as a sample point.
Below are the 4 sampling methods:
-
Cluster Sampling: IN cluster sampling method the population will be divided into groups or clusters.
-
Simple Random: This sampling method simply follows the pure random division.
-
Stratified: In stratified sampling, the data will be divided into groups or strata.
-
Systematical: Systematical sampling method picks every kth member of the population.
7. What is P- value and explain it?
Answer:When we execute a hypothesis test in statistics, a p-value helps us in determine the significance of our results. These Hypothesis tests are nothing but to test the validity of a claim that is made about a population. A null hypothesis is a situation when the hypothesis and the specified population is with no significant difference due to sampling or experimental error.
8. What is Data Science and what is the relationship between Data science and Statistics?
Answer:Data Science is simply data-driven science, also, it involves the interdisciplinary field of automated scientific methods, algorithms, systems, and process to extracts the insights and knowledge from data in any form, either structured or unstructured. Furthermore, It has similarities with data mining, both abstracts the useful information from data.
Data Sciences include Mathematical Statistics along with Computer science and Applications. Also by combing aspects of statistics, visualization, applied mathematics, computer science Data Science is turning the vast amount of data into insights and knowledge.
Similarly, Statistics is one of the main components of Data Science. Statistics is a branch of mathematics commerce with the collection, analysis, interpretation, organization, and presentation of data.
9. What is correlation and covariance in statistics?
Answer:Covariance and Correlation are two mathematical concepts; these two approaches are widely used in statistics. Both Correlation and Covariance establish the relationship and also measure the dependency between two random variables. Though the work is similar between these two in mathematical terms, they are different from each other.
Correlation: Correlation is considered or described as the best technique for measuring and also for estimating the quantitative relationship between two variables. Correlation measures how strongly two variables are related.
Covariance: In covariance two items vary together and it’s a measure that indicates the extent to which two random variables change in cycle. It is a statistical term; it explains the systematic relation between a pair of random variables, wherein changes in one variable reciprocal by a corresponding change in another variable.
Other Important Links
###
Programming
R Interview Questions
1. Explain what is R?
R is data analysis software which is used by analysts, quants, statisticians, data scientists, and others.
2. List out some of the function that R provides?
The function that R provides are
-
Mean
-
Median
-
Distribution
-
Covariance
-
Regression
-
Non-linear
-
Mixed Effects
-
GLM
-
GAM. etc.
3. Explain how you can start the R commander GUI?
Typing the command, (“Rcmdr”) into the R console starts the R Commander GUI.
4. In R how you can import Data?
You use R commander to import Data in R, and there are three ways through which you can enter data into it
-
You can enter data directly via Data New Data Set
-
Import data from a plain text (ASCII) or other files (SPSS, Minitab, etc.)
-
Read a dataset either by typing the name of the data set or selecting the data set in the dialogue box
5. Mention what does not ‘R’ language do?
-
Though R programming can easily connect to DBMS is not a database
-
R does not consist of any graphical user interface
-
Though it connects to Excel/Microsoft Office easily, R language does not provide any spreadsheet view of data
6. Explain how R commands are written?
In R, anywhere in the program, you have to preface the line of code with a #sign, for example
-
subtraction
-
division
-
note order of operations exists
7. How can you save your data in R?
To save data in R, there are many ways, but the easiest way of doing this is
Go to Data > Active Data Set > Export Active dataset and a dialogue box will appear, when you click ok the dialogue box lets you save your data in the usual way.
8. Mention how you can produce co-relations and covariances?
You can produce co-relations by the cor () function to produce co-relations and cov() function to produce covariances.
9. Explain what is t-tests in R?
In R, the t.test () function produces a variety of t-tests. The t-test is the most common test in statistics and used to determine whether the means of two groups are equal to each other.
10. Explain what is With () and By () function in R is used for?
-
With() function is similar to DATA in SAS, it applies an expression to a dataset.
-
BY() function applies a function to each level of factors. It is similar to BY processing in SAS.
11. What are the data structures in R that are used to perform statistical analyses and create graphs?
R has data structures like
-
Vectors
-
Matrices
-
Arrays
-
Data frames
12. Explain the general format of Matrices in R?
General format is
| Mymatrix< - matrix (vector, nrow=r , ncol=c , byrow=FALSE,dimnames = list ( char_vector_ rowname, char_vector_colnames)) |
dimnames = list ( char_vector_ rowname, char_vector_colnames))
13. In R how missing values are represented? In R missing values are represented by NA (Not Available), why impossible values are represented by the symbol NaN (not a number).
14. Explain what is transpose?
For re-shaping data before, analysis R provides a various method and transpose are the simplest methods of reshaping a dataset. To transpose a matrix or a data frame t () function is used.
15. Explain how data is aggregated in R?
By collapsing data in R by using one or more BY variables, it becomes easy. When using the aggregate() function the BY variable should be in the list.
Machine Learning
1. What do you understand by Machine Learning?
Answer:Machine learning is an application of artificial intelligence that provides systems with the ability to automatically learn and improve from experience without being explicitly programmed. Also, machine learning focuses on the development of computer programs that can access data and use it learn for themselves.
2. Give an example that explains Machine Leaning in industry.
Answer:Robots are replacing humans in many areas. It is because robots are programmed such that they can perform the task based on data they gather from sensors. They learn from the data and behaves intelligently.
3. What are the different Algorithm techniques in Machine Learning?
Answer:The different types of Algorithm techniques in Machine Learning are as follows:• Reinforcement Learning• Supervised Learning• Unsupervised Learning• Semi-supervised Learning• Transduction• Learning to Learn
4. What is the difference between supervised and unsupervised machine learning?
Answer:This is the basic Machine Learning Interview Questions asked in an interview. A Supervised learning is a process where it requires training labelled data While Unsupervised learning it doesn’t require data labelling.
5. What is the function of Unsupervised Learning?
Answer:The function of Unsupervised Learning are as below:• Find clusters of the data of the data• Low-dimensional representations of the data• Gaining interesting directions in data• Interesting coordinates and correlations• Figuring novel observations
6. What is the function of Supervised Learning?
Answer:The function of Supervised Learning are as below:• Classifications• Speech recognition• Regression• Predict time series• Annotate strings
7. What are the advantages of Naive Bayes?
Answer:The advantages of Naive Bayes are:• The classifier will converge quicker than discriminative models• It cannot learn the interactions between features
8. What are the disadvantages of Naive Bayes?
Answer:The disadvantages of Naive Bayes are:• The problem arises for continuous features• It makes a very strong assumption on the shape of your data distribution• Does not work well in case of data scarcity
9. Why is naive Bayes so naive?
Answer:Naive Bayes is so naive because it assumes that all of the features in a dataset are equally important and independent.
10. What is Overfitting in Machine Learning?
Answer:This is the popular Machine Learning Interview Questions asked in an interview. Overfitting in Machine Learning is defined as when a statistical model describes random error or noise instead of underlying relationship or when a model is excessively complex.
11. What are the conditions when Overfitting happens?
Answer:One of the important reason and possibility of overfitting is because the criteria used for training the model is not the same as the criteria used to judge the efficacy of a model.
12. How can you avoid overfitting?
Answer:We can avoid overfitting by using:• Lots of data• Cross-validation
13. What are the five popular algorithms for Machine Learning?
Answer:Below is the list of five popular algorithms of Machine Learning:• Decision Trees• Probabilistic networks• Nearest Neighbor• Support vector machines• Neural Networks
14. What are the different use cases where machine learning algorithms can be used?
Answer:The different use cases where machine learning algorithms can be used are as follows:• Fraud Detection• Face detection• Natural language processing• Market Segmentation• Text Categorization• Bioinformatics
15. What are parametric models and Non-Parametric models?
Answer:Parametric models are those with a finite number of parameters and to predict new data, you only need to know the parameters of the model.Non Parametric models are those with an unbounded number of parameters, allowing for more flexibility and to predict new data, you need to know the parameters of the model and the state of the data that has been observed.
16. What are the three stages to build the hypotheses or model in machine learning?
Answer:This is the frequently asked Machine Learning Interview Questions in an interview. The three stages to build the hypotheses or model in machine learning are:1. Model building2. Model testing3. Applying the model
17. What is Inductive Logic Programming in Machine Learning (ILP)?
Answer:Inductive Logic Programming (ILP) is a subfield of machine learning which uses logical programming representing background knowledge and examples.
18. What is the difference between classification and regression?
Answer:The difference between classification and regression are as follows:• Classification is about identifying group membership while regression technique involves predicting a response.• Both the techniques are related to prediction• Classification predicts the belonging to a class whereas regression predicts the value from a continuous set• Regression is not preferred when the results of the model need to return the belongingness of data points in a dataset with specific explicit categories
19. What is the difference between inductive machine learning and deductive machine learning?
Answer:The difference between inductive machine learning and deductive machine learning are as follows:machine learning where the model learns by examples from a set of observed instances to draw a generalized conclusion whereas in deductive learning the model first draws the conclusion and then the conclusion is drawn.
20. What are the advantages decision trees?
Answer:The advantages decision trees are:• Decision trees are easy to interpret• Nonparametric• There are relatively few parameters to tune
Other Important Links
###
Deep Learning
1. What is deep learning?
Answer:The area of machine learning which focuses on deep artificial neural networks which are loosely inspired by brains. Alexey Grigorevich Ivakhnenko published the first general on working Deep Learning network. Today it has its application in various fields such as computer vision, speech recognition, natural language processing.
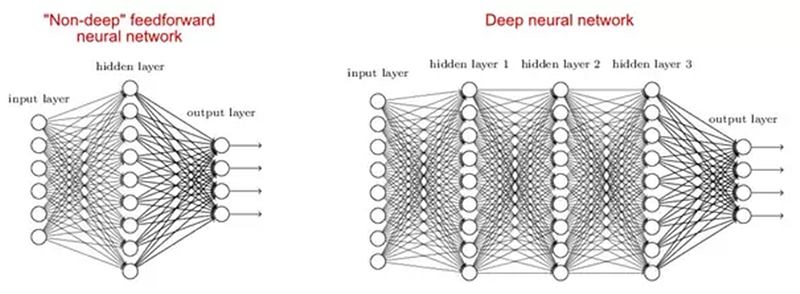
2. Why are deep networks better than shallow ones?
Answer:There are studies which say that both shallow and deep networks can fit at any function, but as deep networks have several hidden layers often of different types so they are able to build or extract better features than shallow models with fewer parameters.
3. What is a cost function?
Answer:A cost function is a measure of the accuracy of the neural network with respect to given training sample and expected output. It is a single value, nonvector as it gives the performance of the neural network as a whole. It can be calculated as below Mean Squared Error function:-MSE=1n∑i=0n(Y^i–Yi)²Where Y^ and desired value Y is what we want to minimize.
4. What is a gradient descent?
Answer:Gradient descent is basically an optimization algorithm, which is used to learn the value of parameters that minimizes the cost function. Furthermore, It is an iterative algorithm which moves in the direction of steepest descent as defined by the negative of the gradient. We compute the gradient descent of the cost function for a given parameter and update the parameter by the below formula:-Θ:=Θ–αd∂ΘJ(Θ)Where Θ — is the parameter vector, α — learning rate, J(Θ) — is a cost function.
5. What is a backpropagation?
Answer:Backpropagation is a training algorithm used for multilayer neural network. In this method, we move the error from an end of the network to all weights inside the network and thus allowing efficient computation of the gradient. It consists of several steps as follows:-
-
Forward propagation of training data in order to generate output.
-
Then using the target value and output value error derivative can be computed with respect to output activation.
-
Then we back propagate for computing derivative of error with respect to output activation on previous and continue this for all the hidden layers.
-
Using previously calculated derivatives for output and all hidden layers we calculate error derivatives with respect to weights.
-
And then we update the weights.
6. Explain the following three variants of gradient descent: batch, stochastic and mini-batch?
Answer:Stochastic Gradient Descent: Here we use only single training example for calculation of gradient and update parameters.Batch Gradient Descent: Here we calculate the gradient for the whole dataset and perform the update at each iteration.Mini-batch Gradient Descent: It’s one of the most popular optimization algorithms. It’s a variant of Stochastic Gradient Descent and here instead of single training example, mini-batch of samples is used.
7. What are the benefits of mini-batch gradient descent?
Answer:Below are the benefits of mini-batch gradient descent•This is more efficient compared to stochastic gradient descent.•The generalization by finding the flat minima.•Mini-batches allows help to approximate the gradient of the entire training set which helps us to avoid local minima.
8. What is data normalization and why do we need it?
Answer:Data normalization is used during backpropagation. The main motive behind data normalization is to reduce or eliminate data redundancy. Here we rescale values to fit into a specific range to achieve better convergence.
9. What is weight initialization in neural networks?
Answer:Weight initialization is one of the very important steps. A bad weight initialization can prevent a network from learning but good weight initialization helps in giving a quicker convergence and a better overall error. Biases can be generally initialized to zero. The rule for setting the weights is to be close to zero without being too small.
10. What is an auto-encoder?
Answer:An autoencoder is an autonomous Machine learning algorithm that uses backpropagation principle, where the target values are set to be equal to the inputs provided. Internally, it has a hidden layer that describes a code used to represent the input.Some Key Facts about the autoencoder are as follows:-
•It is an unsupervised ML algorithm similar to Principal Component Analysis•Minimizes the same objective function as Principal Component Analysis•It is a neural network•The neural network’s target output is its input
11. Is it OK to connect from a Layer 4 output back to a Layer 2 input?
Answer:Yes, this can be done considering that layer 4 output is from previous time step like in RNN. Also, we need to assume that previous input batch is sometimes- correlated with the current batch.
12. What is a Boltzmann Machine?
Answer:Boltzmann Machine is a method to optimize the solution of a problem. The work of the Boltzmann machine is basically to optimize the weights and the quantity for the given problem.Some important points about Boltzmann Machine −•It uses recurrent structure.•Consists of stochastic neurons, which consist one of the two possible states, either 1 or 0.•The neurons in this are either in adaptive (free state) or clamped (frozen state).•If we apply simulated annealing on discrete Hopfield network, then it would become Boltzmann Machine.
13. What is the role of the activation function?
Answer:The activation function is a method to introduce non-linearity into the neural network helping it to learn more complex function. Furthermore, without which the neural network would be only able to learn linear function which is a linear combination of its input data.
Follow this link if you are looking forward to becoming an AI expert
Problem Solving
####
It is the perfect time to move ahead of the curve and position yourself with the skills needed to fill these emerging gaps in data science and analysis. Most importantly, this is not only for people who are at the very beginning of their careers and who decide on the path to study. Hence, professionals already in the workforce can benefit from this data science trend, perhaps even more than their fresh counterparts.
Please follow and like us:
![]()