Jerrod Anderson points us to Table 1 of this paper:
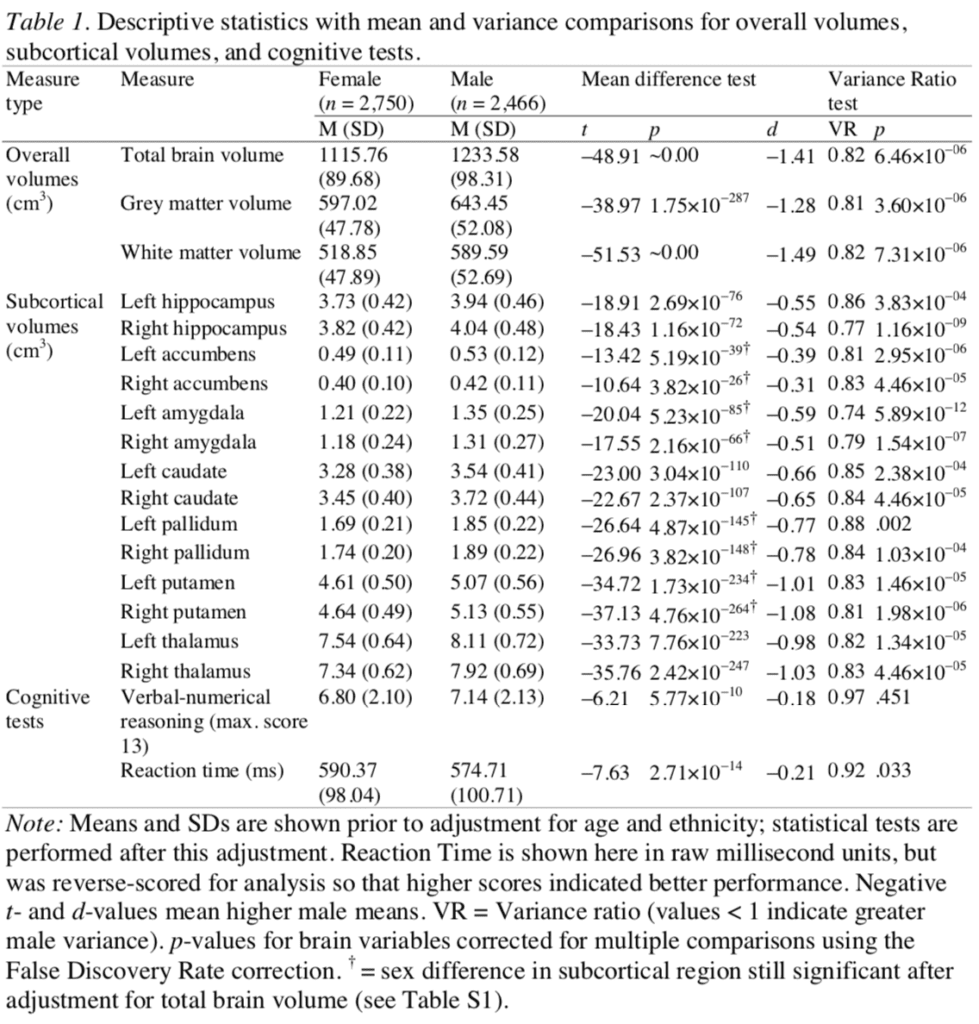
It seems that the null hypothesis that this particular group of men and this particular group of women are random samples from the same population, is false.
Good to know. For a moment there I was worried.
On the plus side, as Anderson notes, the paper includes distributional comparisons:
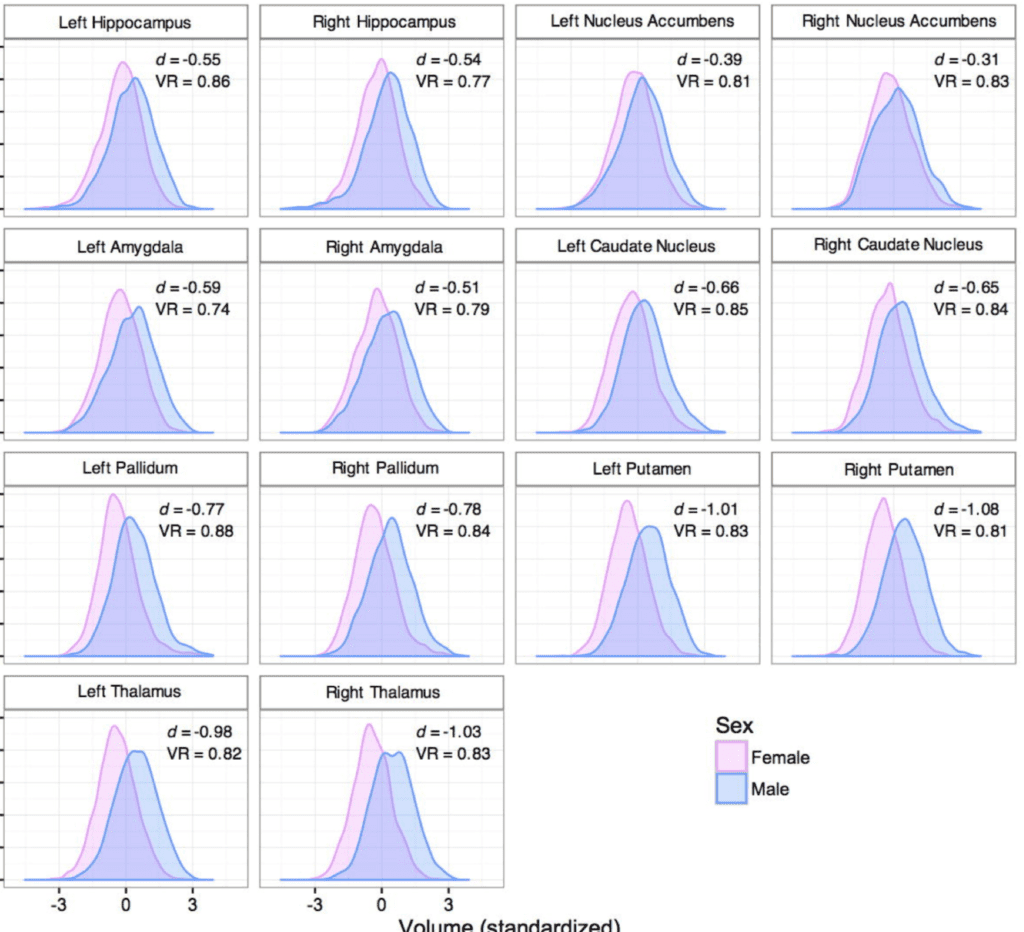
This is fine as a visualization, but I don’t think there’s much here beyond the means and variances. Seems a lot of space to devote to demonstrating that men, on average, are bigger than women. There’s other stuff in the paper as well, but my favorite is the p-value of 4.76×10^−264. I love that they have all these decimal places. Because 4×10^-264 wouldn’t be precise enuf. That’s even worse—actually, a lot worse—than this example.