By Derrick Mwiti, Data Analyst
Sales forecasting is one the most common tasks in many sales driven organizations. This activity enables organizations to adequately plan for the future with a degree of confidence. In this tutorial we’ll use Prophet, a package developed by Facebook to show how one can achieve this. This package is available in both Python and R. We assume that the reader has basic understanding of handling time series data in Python.
Plan of Attack
Introduction and Installation Model Fitting Making Future Predictions Obtaining the Forecasts Plotting the Forecasts Plotting the Forecast Components Cross Validation Obtaining the Performance Metrics Visualizing Performance Metrics Conclusion
Introduction and Installation
There are very many open source forecastings tools, however none of these would be fit to solve all forecasting problems. Prophet works best with hourly, and weekly data that is several months. When working with Prophet yearly data is most prefered. According to Facebook Research:
At its core, the Prophet procedure is an additive regression model with four main components:
- A piecewise linear or logistic growth curve trend. Prophet automatically detects changes in trends by selecting changepoints from the data.2. A yearly seasonal component modeled using Fourier series.3. A weekly seasonal component using dummy variables.4. A user-provided list of important holidays.
Prophet can be installed using pip in Python as shown below. Prophet depends on a Python module called pystan. This module will be installed automatically as we install Prophet.
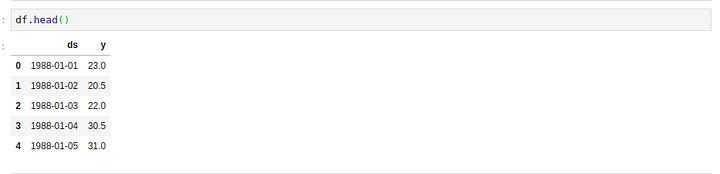
The dataset we’ve used for this tutorial is available here. Once you download the dataset make sure to delete some unnecessary rows towards the end of the file because they might interfere with the analysis. For this univariate analysisProphet expects the dataset to have two columns named as ds and y. ds is the date column while y is the column that we are forecasting.
Let’s get the ball rolling by importing Pandas for data manipulation and Prophet for forecasting. Next we load in our dataset and check its head.
Model Fitting
Since we’ve worked with Scikit-learn before,working with Prophet will be a walk in the park for us. This is because the API implementation for Prophet and Scikit-learn are very similar as we’ll see below. We start by creating an instance of the Prophet class and then fit it to our dataset.
Making Future Predictions
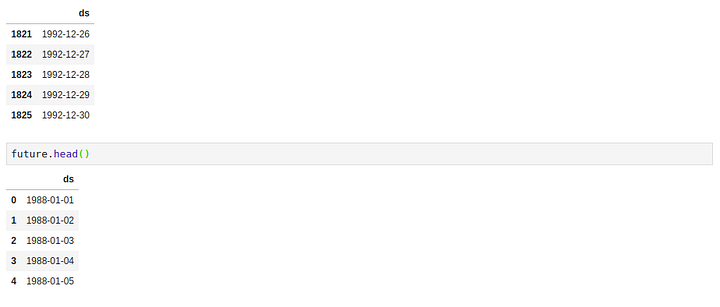
The next step is to prepare our model to make future predictions. This is achieved using the Prophet.make_future_dataframe method and passing the number of days we’d like to predict in the future. We use the periods attribute to specify this. This also include the historical dates. We’ll use these historical dates to compare the predictions with the actual values in the ds column.
Obtaining the Forecasts
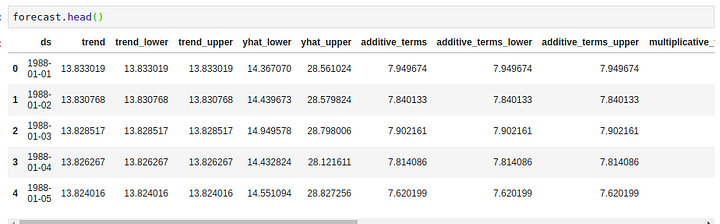
We use the predict method to make future predictions. This will generate a dataframe with a yhat column that will contain the predictions.
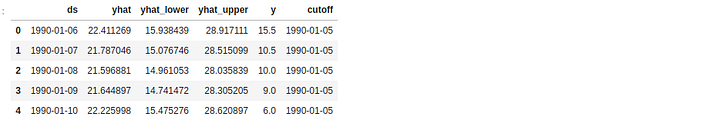
If we check the head for our forecast dataframe we’ll notice that it has very many columns. However, we are mainly interested in ds, yhat, yhat_lower andyhat_upper. yhat is our predicted forecast, yhat_lower is the lower bound for our predictions and yhat_upper is the upper bound for our predictions.
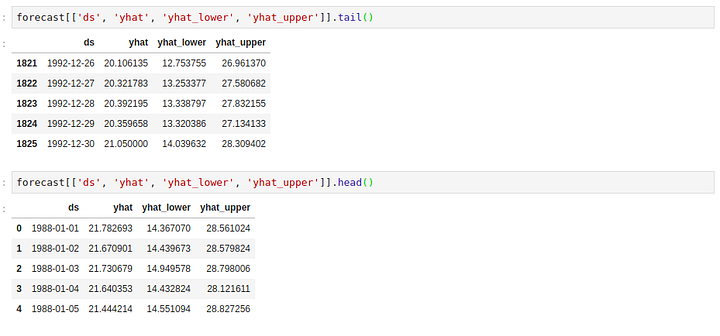
Let’s proceed to check the tail and head of the forecast’s dataframe.
Plotting the Forecasts
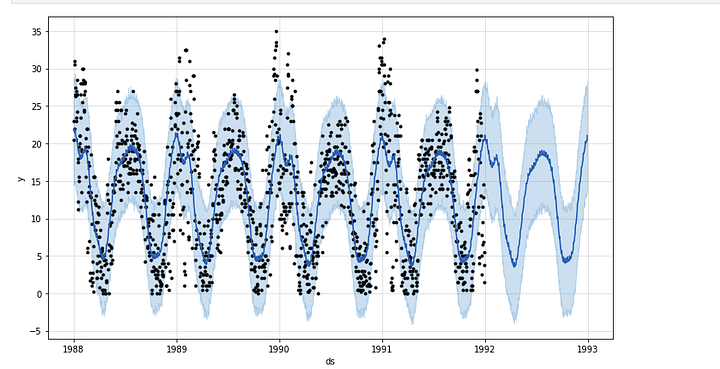
Prophet has an inbuilt feature that enables us to plot the forecasts we just generated. This is achieved using mode.plot() and passing in our forecasts as the argument. The blue line in the graph represents the predicted values while the black dots represents the data in our dataset.
Plotting the Forecast Components
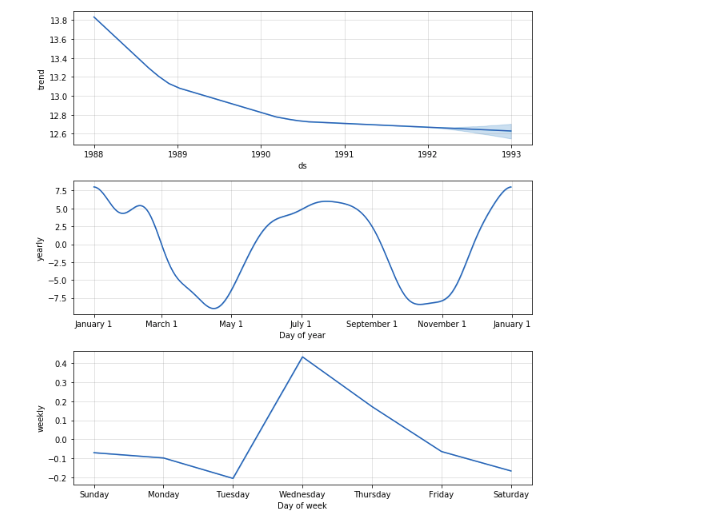
The plot_components method plots the trend, yearly and weekly seasonality of the time series data.
Cross Validation
Next let’s measure the forecast error using the historical data. We’ll do this by comparing the predicted values with the actual values. In order to perform this operation we select cut of points in the history of the data and fit the model with data upto that cut off point. Afterwards we compare the actual values to the predicted values. The cross_validation method allows us to do this in Prophet. This method take the following parameters as explained below:
horizon the forecast horizon initial the size of the initial training period period the spacing between cutoff dates
The output of the cross_validation method is a dataframe containing y the true values and yhat the predicted values. We’ll use this dataframe to compute the prediction errors.
Obtaining the Performance Metrics
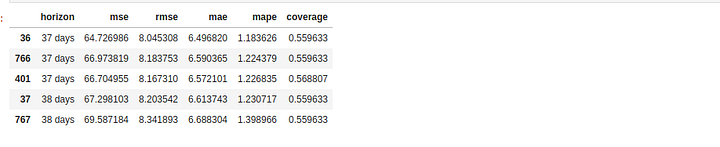
We use the performance_metrics utility to compute the Mean Squared Error(MSE), Root Mean Squared Error(RMSE),Mean Absolute Error(MAE), Mean Absolute Percentage Error(MAPE) and the coverage of the the yhat_lower and yhat_upper estimates.
Visualizing Performance Metrics
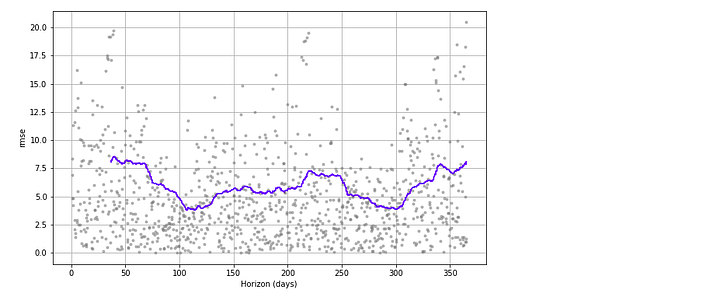
The performance Metrics can be visualized using the plot_cross_validation_metric utility. Let’s visualize the RMSE below.
Conclusion
As we have seen Prophet is very powerful and effective in time series forecasting. However, as we mentioned earlier there are a few other forecasting tools. Choice of tool is on a case by case basis depending on the nature of the dataset. One can always compare these tools and use the one that gives the best predictions with the least amount of errors. Some of these methods include ARIMA, Holt-Winters’ Method, Holt’s linear trend, Simple exponential smoothing and Moving Averages among others. You can learn more about Prophet from the official docs or by reading Prophet’s Paper.
Bio: Derrick Mwiti is a data analyst, a writer, and a mentor. He is driven by delivering great results in every task, and is a mentor at Lapid Leaders Africa.
Related: