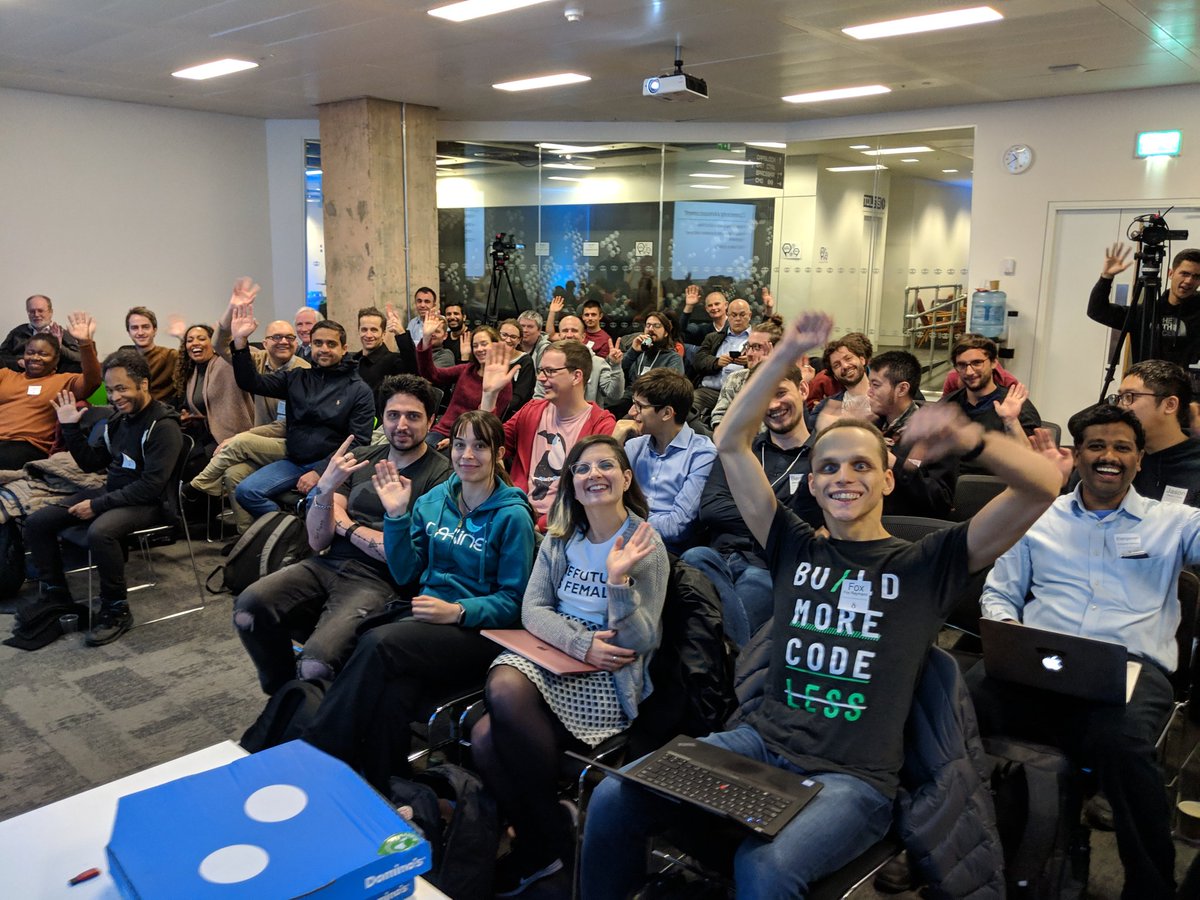
Mario of PyLondonium (where I gave a keynote talk earlier this year) was kind enough to ask me along to speak at Linuxing in London. I gave an updated version of one of my older High Performance Python talks based on material I’d covered in my book, to show the more-engineering audience how to go about profiling and speeding up Python code. The audience was lovely, many were new to Python and also first-timers at the meetup, here’s half the room:

We covered:
-
Profiling with line_profiler (in a Notebook – thanks Robert!) to identify slow code in functions
-
Using numpy incorrectly to try to get a speed up, then profiling it to see why it didn’t work
-
Using Anaconda’s Numba on the numpy code to get a 20* overall speedup
-
Using a different algorithm entirely to get a further 1000* speedup (!)
-
Thoughts on the two main ways to get a speed-up (do less work or spend less time waiting for data)
-
Looking at Py-Spy which hooks into an existing process to profile on-the-fly – a take-away for anyone in an engineering team
Here’s a link to the slides.Thanks to Brian, David and the other organisers for hosting the four of us, it was a fun evening.
I also mentioned my London-based jobs and training email lists and promised to link them here. It was fun to speak to a less-data-science focused audience (where PyData is pretty much my bubble-reality nowadays), especially to meet new folk transitioning into Python from entirely non-technical careers. I reminded everyone that they’re most welcome to visit our PyDataLondon meetups to widen their network, of course London Python and PyConUK should definitely be on your radar too.