A couple of days back I spoke on using diagrams (matplotlib, seaborn, pandas profiling) to diagnose data during the exploratory data analysis phase. I also introduced my new tool discover_feature_relationships which helps prioritise which features to investigate in a new dataset by identifying pairs of features that have some sort of ‘interesting’ relationship. We finished with a short note on Bertil’s ‘data story‘ concept for documenting the EDA process.
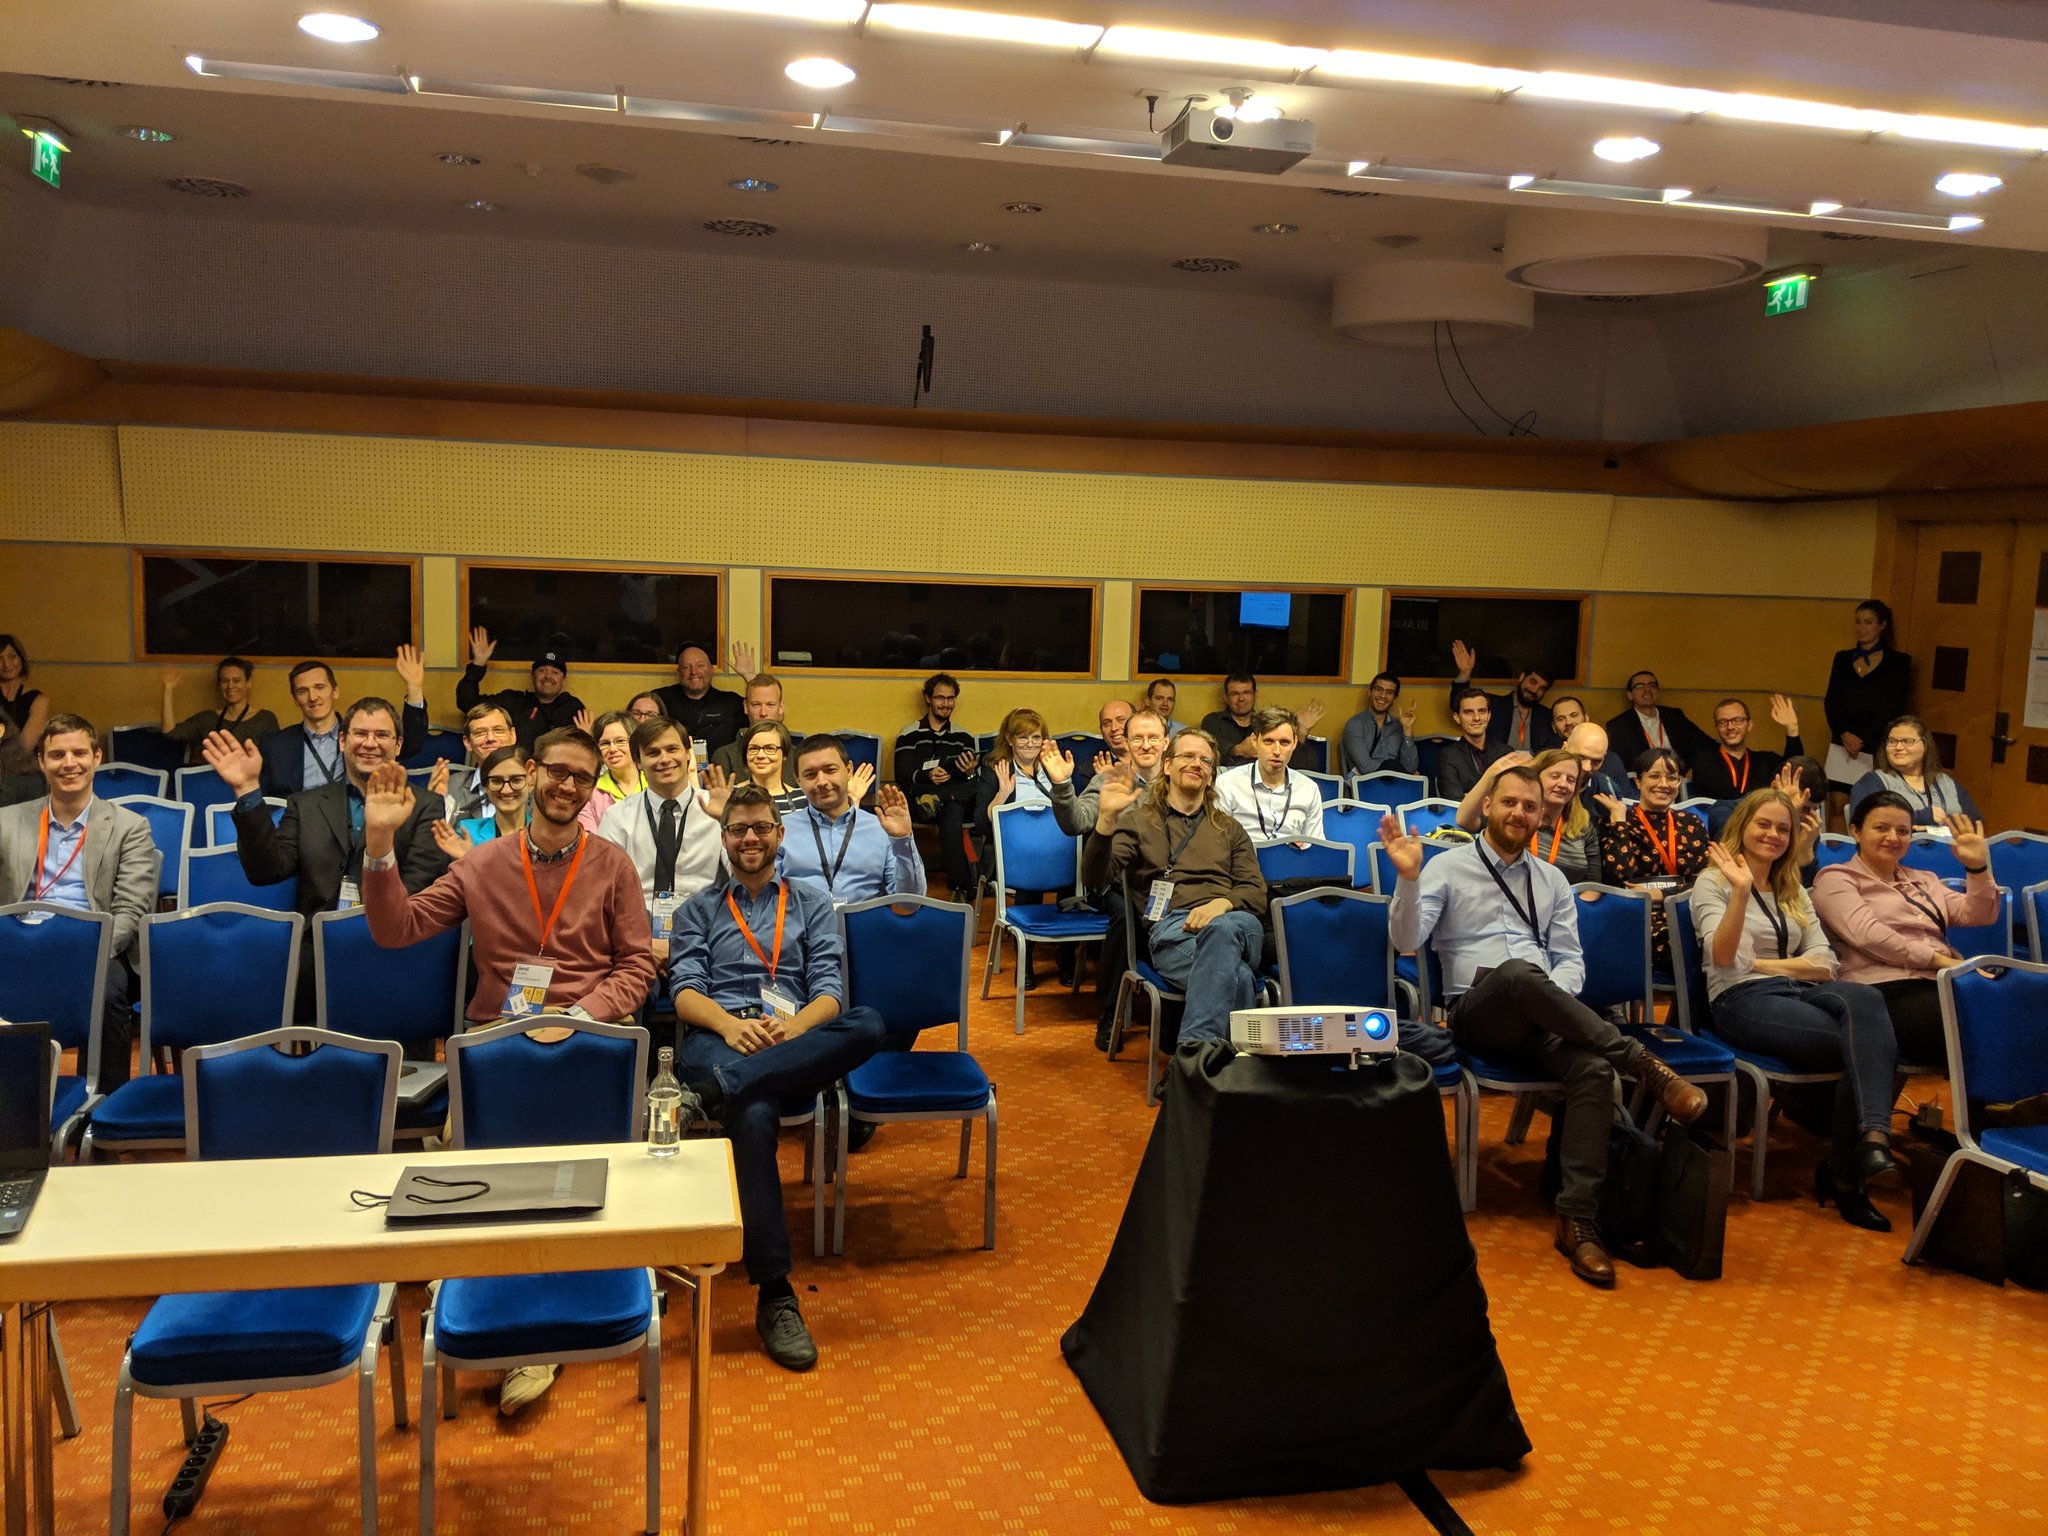
I had a lovely room of international folk. We had a higher proportion of Hungarians this year as the organiser Bence has worked to build up the local community. This was followed by a variety of interesting questions around ways to tackle the EDA challenge:

My new tool discover_feature_relationships uses a Random Forest to identify predictive (and possibly non-linear) relationships between all pairs of columns in a dataframe. Typically we’d like to identify which features identify a target in machine learning, here instead I’m asking “what relationships exist throughout my data?”. I’ve used this to help me understand how data ‘works’, this is especially useful in semi-structured business data dumps which aren’t necessarily the right source of data to solve a particular task, but where up-front we don’t know what we have and what we need. I’d certainly welcome feedback on this idea, you’ll see diagrams and example for the Boston and Titanic datasets on the github page.
Next year I’d like to run some courses on the subject of successful project delivery (which includes “what have I got and what do I need to solve this challenge?!”), if you’d like to hear about that then you might want to join my training notification list.
Here are the slides for my talk: