Following up on the post that we linked to last week, here’s Yair’s analysis, using Mister P, of how everyone voted.
Like Yair, I think these results are much better than what you’ll see from exit polls, partly because the analysis is more sophisticated (MRP gives you state-by-state estimates in each demographic group), partly because he’s using more data (tons of pre-election polls), and partly because I think his analysis does a better job of correcting for bias (systematic differences between the sample and population).
As Yair puts it:
We spent the last week combining all of the information available — pre-election projections, early voting, county and congressional district election results, precinct results where we have it available , and polling data — to come up with our estimates.
In future election years, maybe Yair’s results, or others constructed using similar methods, will become the standard, and we’ll be able to forget exit polls, or relegate them to a more minor part of our discourse.
Anyway, here’s what Yair found:
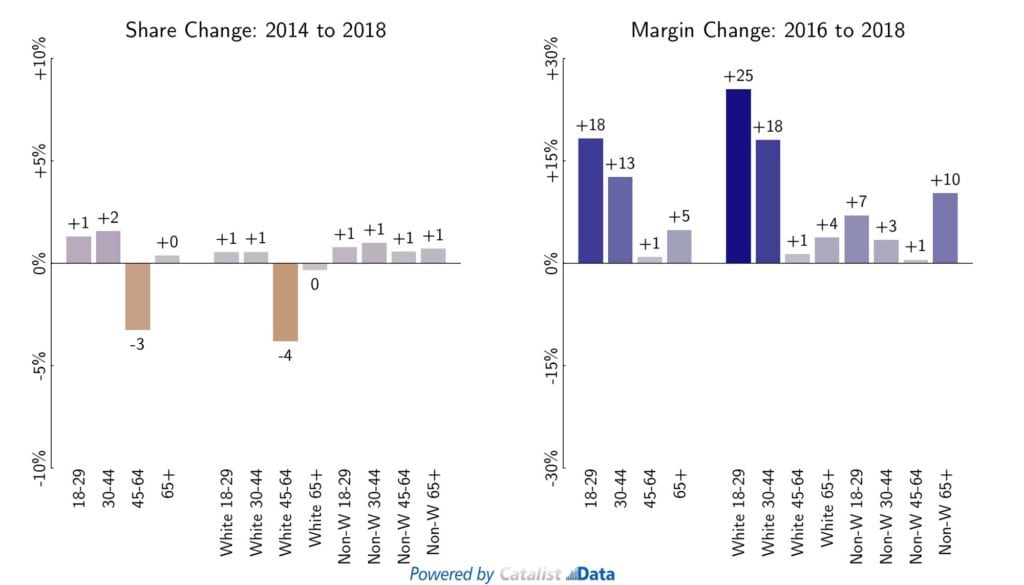
The breakdown by age. Wow:

Changes since the previous midterm election, who voted and how they voted:
Ethnicity and education:


Urban/suburban/rural:


Yair’s got more at the link.
And here’s our summary of what happened in 2018, that we posted a few days after the election.