By Thijs Kooi, Merantix
1. Zipf’s law
The most commonly used word in the English language is ‘the’, accounting for about 7% of all words in an average text. The second most commonly used word, ‘of’, occurs about 3.5%, half as much as the first. After that, the relative word frequency quickly levels off and many words may occur only a few times in very large corpora and not at all in an average text.
This relationship was first described by linguist George Kingsley Zipf and became known as Zipf’s law. It can be summarized as: ‘few words are used a lot and a lot of words are used sparingly’. A type of relation like this is also known as a ‘power law’ and is not only seen in language, but in many other fields such as population statistics (few cities have a lot of inhabitants, many have a few) and distributions of wealth (few people have a lot of money, many people have a bit). These relations are interesting in itself to study, but are particularly relevant for people who want to build models on top of these distributions that make predictions about this data.
Machine learning models are mathematical functions that make such predictions based on numerical input. Although different variations exist, by far the most popular models used in production nowadays are simple ‘signal in — prediction out’ systems, that take something like a speech audio sequence or an image and predict a number which usually represents an instance of a class such as cat/dog or cancer/no cancer.
The functions are equipped with some parameters that can be tuned in such a way that they make the fewest possible errors (predicting that a dog is a cat, or predicting a cancer is not a cancer) on a ‘training set’: a set of example inputs and outputs. Ideally, we want this set to comprise of all possible examples that are out there, but unfortunately, the data we have to train the model is often limited. When taking a random sample, say 100 words from a corpus of English, 7 of these will be ‘the’ and about 3 or 4 will be ‘of’. Because there are thousands of words, many occurring only once, it is impossible for a sample smaller than the dictionary to contain all.
Now let’s assume we have two such sets: a set of English words and a set of Japanese words and we want to train a model to predict which language it is from: a ‘word in — class label out’ task. Feeding words immediately to the algorithm is not possible because our model works with numbers. To get these numbers, we take two ‘features’ from every (Romanized) word in every set:
- The length of the word in Roman characters (Japanese words tend to be quite long)2. The number of syllables in the word (Japanese words tend to have short syllables)
We can plot the words as points in a two-dimensional space, train our model on these points and plot the discriminant originating from our model, which is supposed to split the two classes. Looking at this line, we can see that, except for very short words, it works relatively well for frequent words and also for some less common words.

To test how well it works on unseen words, we can map them to our two-dimensional feature space and see on which side of the curve they end up. However, when adding the rare word ‘onomatopoeia’, which has a relatively large amount of syllables, we can see it is up on the wrong side of the discriminant.
A solution of course, is to collect more training data until we have examples of all possible words in a language, which is possible in theory and in practice. After all, there is a limited number of words in every language. For other areas such as images however, this may be possible in theory, but not in practice. For instance, a 512 by 512 image with three eight bit channels can have 134,217,728 possible manifestations. Although the distribution of possible images may not follow the same power law as for language, the ‘long tail’ of rare cases is often present.
In academia these types of rare samples could simply be brushed aside and for some industrial settings like face detection in commodity cameras, this may also not cause major problems. In fields such as medicine, however, where we make predictions such as whether a patient has cancer or not and human lives depend on accurate predictions, we can not simply ignore the problem of rare samples.
2. Medical data
Experts in both health care and artificial intelligence are recently starting to realize the largely untapped amounts of medical data and immense potential machine learning can have in medicine. With about a billion chest X-rays, millions of mammograms and thousands of SPECT scans [3] recorded annually, medical images are a large part of this unanalyzed data. Although radiology is a complicated field, requiring much more than just classifying images, experts agree that 50–80% of the work revolves around ‘image in — label out’ problems that could be automated in the next few decades, using machine learning models similar to the one described above.
One of the first areas in medical image analysis where machine learning was applied is the diagnosis of breast cancer in (screening) mammography. Breast cancer is a common type of cancer, affecting about 1 in 8 women at some point in their lifetime. Research shows early detection can significantly increase chances of survival and therefore screening initiatives have been introduced in many countries. In these screenings, asymptomatic women (subjects without any symptoms but in high risk groups) undergo regular breast exams in the form of a mammogram, an X-ray image of the breast, in the hope to find the cancer earlier than it would otherwise be detected.
These initiatives generate an enormous amount of data. About 40 million mammograms are recorded every year in the US alone. All this data has to be read by experienced readers, which is time consuming and, most importantly, error-prone. Computer aided diagnosis (CAD) systems: computer algorithms based on machine learning, help the readers analyze these images by, for instance, showing markers around suspicious areas in the image, to prevent readers from missing any cancers.
Just like the model described above tries to discriminate between different languages, these CAD systems will try to discriminate between normal and malignant images. Unfortunately also similar to the language example, we will always have a limited amount of training data and sample from an incredibly large amount of all possible anomalies in images. This means many rare samples are, almost by definition, not included in the training set.
We see two types of rare samples:
Rare ‘within-class’ samples
In the language example above, we tried to group words into two classes: Japanese and English. As shown in the plot of our data, rare samples within these classes can deviate so much from the data distribution that they end up in areas of the feature space for which the model has not been optimized.
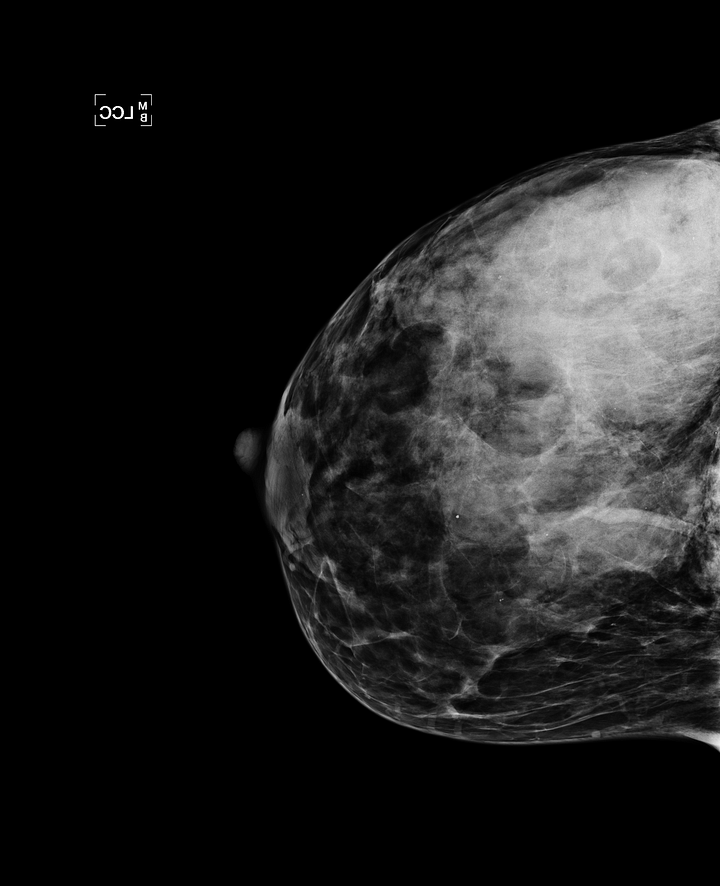
The most common sign of cancer on mammograms are masses: white blobs are typically quite small, something in the order of one to three centimeters. Larger masses of five or six centimeters are rare, but do occur and are typically the sign of a very invasive cancer. Two examples of such masses are shown below. If a model is trained on a random sample from screening data, it is unlikely any of these large masses are found in this limited sample. If they are, the model may simply ignore them as a result of regularization applied to the model, which forces it to come up with simple solutions. During deployment, the model may mistake it for a normal case.
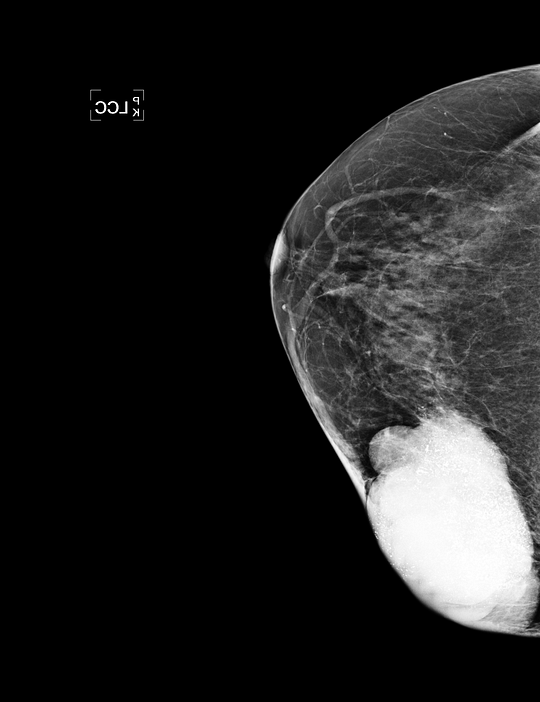
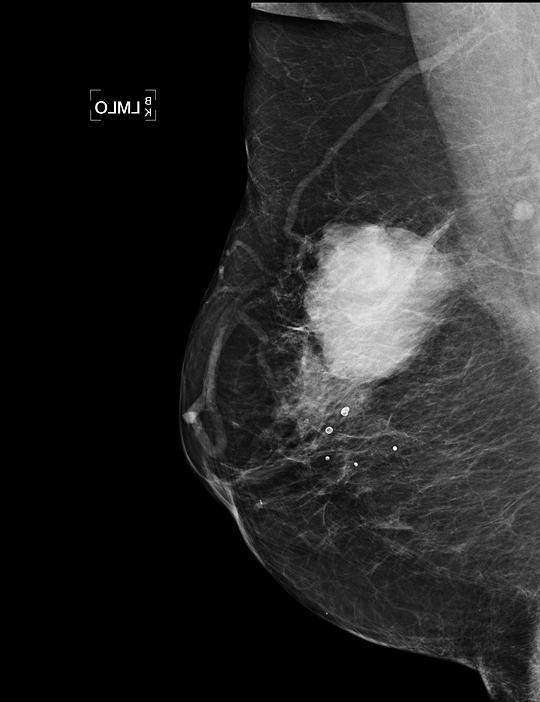 Examples of rare extremely large masses. Because a computer aided diagnosis algorithm is likely not trained on cancers this size, they may be missed by the model. If the algorithm operates independently, this can have great consequences for the patient.
Rare classes
In the language example above, we assumed two classes: English and Japanese. In a more general situation, we may want to discriminate between all possible languages in the world. At the time of writing, there are about 6500 languages spoken today and some languages only have a few hundred speakers and therefore provide a limited amount of examples. If we generate a random sample of words from all possible languages, rare languages are likely highly underrepresented.
In mammography, masses are a common but not the only sign of breast cancer. If we want to build a general breast cancer classifier, all possible classes have to be detected. Findings such as skin and trabecular thickening [4] can be an indicator of an invasive inflammatory breast cancer, but are very rare (an example is shown in the image below). By taking a random set of 10,000 mammograms from a screening population, we are unlikely to see any of these. It is therefore of vital importance to not only focus on collecting a lot of data, but also on the collection of rare cases.
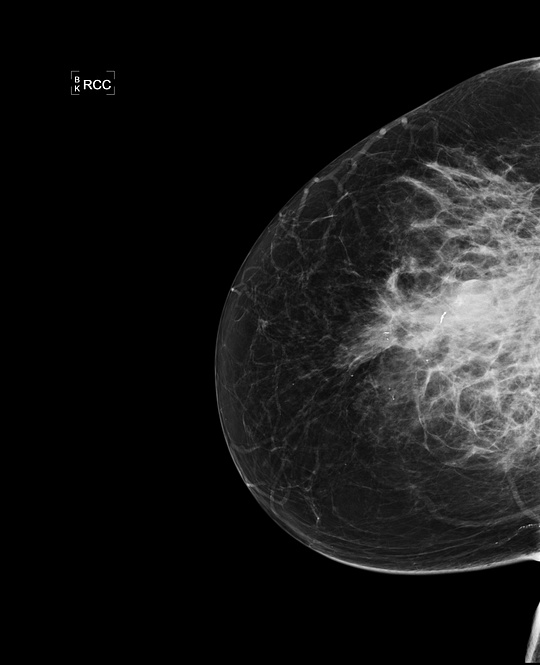
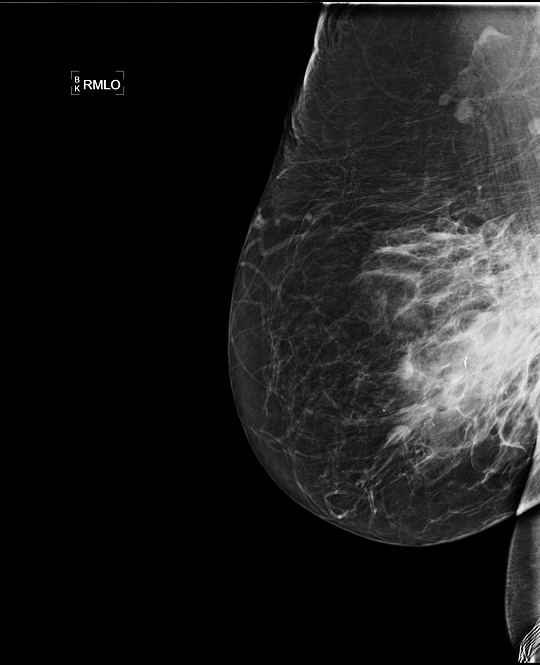 Examples of inflammatory breast cancer, a rare indication of cancer. Because this class is rare, it is likely to be in a small random sample from a screening population and the model may not be able to detect it. At Merantix we take special care in composing our training and testing data, to make sure all possible signs of cancer are detected.
3. Computer aided diagnosis and rare findings
As mentioned earlier, computer aided diagnosis systems use machine learning algorithms to make predictions about medical data. Although a completely autonomous system has recently received FDA approval [1], it will still be some time before we can expect fully automated ‘computerized diagnosis’ for most radiological tasks. Until that time, the system should ‘aid’ the readers (the reason it is called computer ‘aided’ diagnosis) and compensate for errors the human expert makes. In both the independent and aided setting misclassifications of rare ‘long tail’ cases are a problem:
Computerized diagnosis
Missing large tumors or other rare findings is an obvious problem when an algorithm is used independently. If the tumors are large, they are likely in a more advanced stage and therefore a greater risk to the patient. The consequences of an algorithm missing these may be greater than for small tumors that would have been missed by humans.
Computer aided diagnosis
When the algorithm is used in combination with the doctor, rare anomalous cases may be less of a problem to the patient, since the doctor will typically catch them, but a big problem for algorithm developers. Humans anthropomorphize computers. When people talk about computers, you often hear phrases like ‘the computer is thinking X’, ‘the computer is asking me to do Y’. This is a common phenomenon and does not only hold for people new to IT. Many people falsely assume computers ‘think’ or ‘see’ like us and will make the same mistakes as we do.
When doctors use the algorithm and see that it does not flag a massive cancer right in the center of the image, they may quickly assume the algorithm is ‘stupid’ and lose faith in the method even though it may pinpoint masses the doctors would have missed.
4. Anomaly detection
Imagine we show a group of humans images of normal living rooms, saying “these are normal rooms”. If we now show an image of a (probably rather big) living room with an elephant in it, everyone would be able to say there is something wrong with the image. This may seem obvious: we know from experience that elephants don’t belong in living rooms. However, the reverse is most likely going to work as well: if we show 10 images of living rooms with elephants in them and one without, humans would be able to identify the anomaly.
A similar thing will hold for mammograms: although a trained eye may be required to identify small and subtle cancers, most humans will be able to see something is wrong when a big mass is in the center of the image (see picture) after seeing only a few normal mammograms. Humans are particularly good at this and there are even studies that show most of human cognition is actually prediction, based on internal models of ‘how the world is supposed to behave’ and only deviations from those predictions will be noticed [5].
Discriminative models that are trained to separate classes, such as the model described above, can behave capriciously when they are asked to make predictions about rare cases, something we do not want when human lives depend on it. A different type of machine learning models does not learn a function to discriminate between classes, but learns about the distribution of the data: generative models. Using such methods we can make a model of everything that is ‘normal’ and perform anomaly or novelty detection by identifying samples that deviate too much from what we expect.
One could argue that we are still facing the same problem: the long tail for non-cancerous samples may be just as long as the tail of the cancerous class. However, long tail samples of the non-cancerous class are almost by definition not ‘normal’ and should be subjected to further scrutiny by a human and/or additional examinations, even though they are not cancerous. Additionally, since medical problems are often highly imbalanced (in a breast cancer screening population, only about 7 out of 1000 mammograms actually have cancer), getting training data from normal samples will often be much easier.
Work on anomaly detection has been going on for decades and has applications in fraud detection, identifying strange patterns in networks and has even been used for mammograms before [6]. Work on contemporary methods for medical data shows promising results [7], but it may still be some time before such models are used in production. Since most of these models are trained on one class only, we effectively throw away information during training, even if we only have a few samples of the other class. The optimal model may be a combination of an anomaly detector and a supervised system.
Rare samples are something to be taken into careful consideration, not only in training, but also in testing. An increasing amount of papers show human performance for medical applications, but mostly on a limited academic training set. Before AI algorithms are deployed in the clinic, it would be wise to consider the ramifications of missing these rare cases for every individual application.
At Merantix we not only work with very large datasets, but also perform regular ‘stress tests’ using datasets carefully composed of rare and anomalous samples. Using this data and taking the ‘long tail’ into account will ensure that the inevitable transition from human to computerized diagnosis over the next decades will run as smoothly and safely as possible.
Acknowledgement
Thanks to Jonas Probst, Clemens Viernickel, Stefan Bunk, Christian Leibig, Florian Wirth, Moritz Brehmer and Rasmus Rothe for their proofreading and suggestions.
References
[1] https://www.eyediagnosis.net/
[2] https://www.wordfrequency.info/free.asp?s=y
[3] https://www.england.nhs.uk/statistics/wp-content/uploads/sites/2/2016/08/Provisional-Monthly-Diagnostic-Imaging-Dataset-Statistics-2017-05-18.pdf
[4] Imaging inflammatory breast cancer — Alunni, Diagnostic and Interventional Imaging Volume 93, Issue 2, February 2012, Pages 95–103
[5] Bubic A, von Cramon DY, Schubotz RI. Prediction, Cognition and the Brain. Frontiers in Human Neuroscience. 2010;4:25. doi:10.3389/fnhum.2010.00025.
[6] Tarassenko, L., Hayton, P., Cerneaz, N. and Brady, M., 1995. Novelty detection for the identification of masses in mammograms.
[7] Unsupervised Anomaly Detection with Generative Adversarial Networks to Guide Marker Discovery — Schlegl et al. https://arxiv.org/abs/1703.05921
Bio: Thijs Kooi is a machine intelligence engineer at Merantix.
Original. Reposted with permission.
Related: