Amazon SageMaker provides several built-in machine learning (ML) algorithms that you can use for a variety of problem types. These algorithms provide high-performance, scalable machine learning and are optimized for speed, scale, and accuracy. Using these algorithms you can train on petabyte-scale data. They are designed to provide up to 10x the performance of the other available implementations. In this blog post, we will explore k-means, which is an unsupervised learning problem. In addition, we’ll walk through the details of the Amazon SageMaker built-in k-means algorithm.
What is k-means?
The k-means algorithm attempts to find discrete groupings within data, where members of a group are as similar as possible to one another and as different as possible from members of other groups (see the following figure). You define the attributes that you want the algorithm to use to determine similarity. Another way you can define k-means is that it is a clustering problem that finds k cluster centroids for a given set of records, such that all points within a cluster are closer in distance to their centroid than they are to any other centroid.
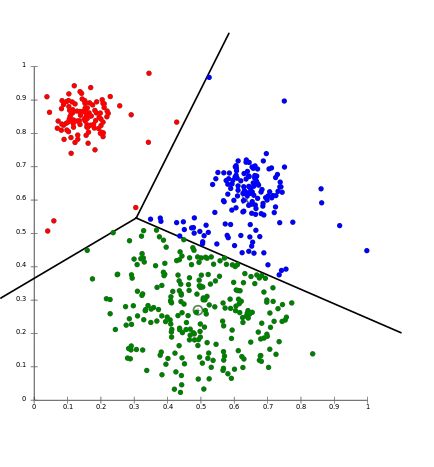
The diagram demonstrates that in the given dataset, there are three obvious clusters marked red, blue, and green. Each cluster has a cluster center. Note that the points in each cluster are spatially closer to the cluster center they are assigned to than the other cluster centers.**
Mathematically, it can be interpreted as follows:
Given: S={x1…xn}, a set S of n vectors of dimension d and an integer k
Goal: Find C={µ1… µk }, a set of k cluster centers, that minimize the expression:

Where can you use k-means?
**The k-means algorithm can be a good fit for finding patterns or groups in large datasets that have not been explicitly labeled. Here are some example use cases in different domains:
E-commerce
-
Classifying customers by purchase history or clickstream activity.
-
Detecting patterns for diseases or success treatment scenarios.
-
Grouping similar images for image detection.
-
Detecting fraud by detecting anomalies in the dataset. For example, detecting credit card frauds by abnormal purchase patterns.
-
Building a network intrusion detection system that aims to identify attacks or malicious activity.
-
Detecting anomalies in sensor data collection such as storm forecasting.
We’ll provide a step-by-step tutorial for k-means using the Amazon SageMaker built-in k-means algorithm and the technique to select an optimal k for a given dataset.
The Amazon SageMaker k-means algorithm
The Amazon SageMaker implementation of k-means combines several independent approaches. The first, is the stochastic variant of Lloyds iteration, given by [Scully’ 10 https://www.eecs.tufts.edu/~dsculley/papers/fastkmeans.pdf]. The second is a more theoretical approach based on facility location [Mayerson’ 01 http://web.cs.ucla.edu/~awm/papers/ofl.pdf and subsequent works]. The third is the divide and conquer, or core-set approach [Guha et al.’ 03 http://theory.stanford.edu/~nmishra/Papers/clusteringDataStreamsTheoryPractice.pdf].
The high-level idea is to implement the stochastic Lloyd variant of [Scully’ 10], yet with more centers than required. During the data processing phase we keep track of the cluster sizes, disregard centers with small clusters, and open new centers using techniques inspired by facility location algorithms. To handle the state having more centers than needed we use a technique inspired by core-sets, and we represent the dataset as the larger set of centers, meaning that each center represents the data points in its cluster. Given this view, after we finish processing the stream, we finalize the state into a model of k centers by running a local version of k-means, clustering the larger set of centers, with k-means++ initialization and Lloyds iteration.
Highlights
Single pass. Amazon SageMaker k-means is able to obtain a good clustering with only a single pass over the data. This property translates into a blazing fast runtime. Additionally, it allows for incremental updates. For example, imagine we have a dataset that keeps growing every day. If we require a clustering of the entire set, we don’t need to retrain over the entire collection every day. Instead, we can update the model in time proportional only to the new amount of data.
Speed and GPU support.Other than having a single pass implementation, our algorithm can be run on a GPU machine achieving blazing-fast speed. For example, processing a 400-dimensional dataset of 23 M entries (~37 GB of data), with k=500 clusters can be done in 7 minutes. The cost is a little over one dollar. For comparison, a popular and fast alternative of Spark-streaming k-means would require 26 minutes to run and cost about $ 8.50.
To explain the advantage of using GPUs, notice that the time it takes to process each data point of dimension d is O(kd) with k being the number of clusters. For a large number of clusters, GPU machines provide a much faster (and cheaper) solution than CPU implementations.
| Accuracy. Although we require a single pass, our algorithm achieves the same mean square distance cost as the state-of-the-art multiple pass implementation of k-means++ (or k-means | ) initialization coupled with Lloyds iteration. For comparison, in our experiments current implementations of a single pass solution, based on minor modifications of the paper [Scully ‘10] achieve a clustering with a mean square distance of 1.5-2 times larger than that of the multi-pass solutions. |
Getting started
In our example, we’ll use k-means on the GDELT dataset, which monitors world news across the world, and the data is stored for every second of every day. This information is freely available on Amazon S3 as part of the AWS Public Datasets program.
The data are stored as multiple files on Amazon S3, with two different formats: historical, which covers the years from 1979 to 2013, and daily updates, which cover the years from 2013 on. For this example, we’ll stick to the historical format. Let’s bring in 1979 data for the purpose of interactive exploration. We’ll import the required libraries and write a simple function so that later we can use it to download multiple files. Replace user-data-bucket with your Amazon S3 bucket.
1 | |
As we can see, there are 57 columns, some of which are sparsely populated, cryptically named, and in a format that’s not particularly friendly for machine learning. So, for our use case, we’ll strip down to a few core attributes. We’ll use the following:
-
EventCode: This is the raw CAMEO action code describing the action that Actor1 performed upon Actor2. More detail can be found at (https://www.gdeltproject.org/data/documentation/CAMEO.Manual.1.1b3.pdf)
-
NumArticles: This is the total number of source documents containing one or more mentions of this event. This can be used as a method of assessing the “importance” of an event. The more discussion of that event, the more likely it is to be significant.
-
AvgTone: This is the average “tone” of all documents containing one or more mentions of this event. The score ranges from -100 (extremely negative) to +100 (extremely positive). Common values range between -10 and +10, with 0 indicating neutral.
-
Actor1Geo_Lat: This is the centroid latitude of the Actor1 landmark for mapping.
-
Actor1Geo_Long: This is the centroid longitude of the Actor1 landmark for mapping.
-
Actor2Geo_Lat: This is the centroid latitude of the Actor2 landmark for mapping.
-
Actor2Geo_Long: This is the centroid longitude of the Actor2 landmark for mapping.
We will now prepare our data for machine learning. We will also use a few functions to help us scale this to GDELT datasets from other years.
1 | |
We will now use the training data and visualize using t-Distributed Stochastic Neighbor Embedding (TSNE). TSNE is a non-linear dimensionality reduction algorithm used for exploring high-dimensional data.
1 | |
After we have explored our data and we are ready for modeling, we can begin training. For this example, we are using data for years 1979 to 1980.
1 | |
We’ll run the training algorithm from values of k from 2 to 12 to determine the right number of clusters. If you are running training jobs in parallel, ensure that you have Amazon EC2 limits in your account to create the instances that are required for parallel training. To request a limit increase see the AWS service limits documentation. In our case, we are using 24 ml.c4.8xlarge in parallel. You can run jobs sequentially by setting the variable run_parallel_jobs to false. Our training job ran for approximately 8 minutes. For pricing details please refer the Amazon SageMaker pricing page.
1 | |
Now that we have started the training jobs, let’s poll for the jobs to ensure that all the jobs are complete. This is only used when training jobs run in parallel.
1 | |
We will now identify the optimal k for k-means using the elbow method.
1 | |
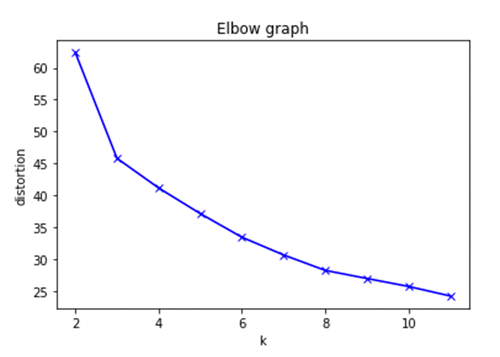
In the graph we plot the Euclidean distance to the cluster centroid. You can see that the error decreases as k gets larger. This is because when the number of clusters increases, they should be smaller, so distortion is also smaller. This produces an “elbow effect” in the graph. The idea of the elbow method is to choose the k at which the rate of decrease sharply shifts. Based on the graph above, k=7 would be a good cluster size for this dataset. Once completed, make sure to stop the notebook instance to avoid additional charges.
Conclusion
In this post, we showed you how to use k-means to evaluate common clustering problems. Using k-means on Amazon SageMaker provides additional benefits like distributed training and managed model hosting without having to set up and manage any infrastructure. You can refer to Amazon SageMaker sample notebooks to get started.
About the Authors
 Gitansh Chadha is a Solutions Architect at AWS. He lives in the San Francisco bay area and helps customers architect and optimize applications on AWS. In his spare time, he enjoys the outdoors and spending time with his twin daughters.
 Piali Das is a Software Development Engineer on the AWS AI Algorithms team, which is responsible for building the Amazon SageMaker’s built-in algorithms. She enjoys programming for scientific applications in general and has developed an interest in machine learning and distributed systems.
 Zohar Karnin is a Principal Scientist in Amazon AI. His research interests are in the area of large scale and online machine learning algorithms. He develops infinitely scalable machine learning algorithms for Amazon SageMaker.