By Adolfo Martínez, Data Scientist at datank.ai.
Original Slides
Humans and uncertainty
Since their early days, humans have had an important, often antagonistic relationship with uncertainty; we try to kill it everywhere we find it. Without an explanation for many natural phenomena, humans invented gods to explain them, and without certainty of the future, they consulted oracles.
It was precisely the oracle’s role to reduce uncertainty for their fellow humans, predicting their future and giving counsel according to their gods’ will, and even though their accuracy left much to be desired, they were believed, for any measure of certainty is better than none.
As society grew sophisticated, oracles were (not completely) displaced by empiric thought, which proved much more successful at prediction and counsel. Empiricism itself evolved into the collection of techniques we call the scientific method, which has proven to be much more effective at reducing uncertainty, and is modern society’s most trustworthy way of producing predictions. Statistics play a central role in most of science, providing the main instrument for measuring evidence and evaluating hypotheses. (Although the mainstream approach is deeply flawed in this regard).
Recently, advances in both statistical and computational theory and computing power have enabled the analysis of huge volumes of data, making predictions and recommendations possible without the need for a general theory, even leading some to proclaim that the scientific method is obsolete. Although I don’t agree, the power of this tools can’t be denied. This power, together with the complexity of both theory and practice that surrounds these tools, have turned those who wield it into the modern equivalent of oracles.
But tools have limitations, and the understanding of these is paramount for their users. In particular, I would like to talk about the limitations of two of the most popular tools for dealing with uncertainty: Frequentist Statisticsand Supervised Learning.
Frequentist Statistics and its Limitations
Frequentism is the notion that frequencies approximate probability. Most of us are taught this notion in high school: toss a coin a bunch of times, compute the frequency of heads, compare with the theoretical probability of heads for a fair coin, and so on. Following this idea, probabilities are defined as the limit of the frequency when the “random experiment” is repeated. The more you can repeat it, the better approximation of a probability you will have. The collection of techniques derived from this idea is used in most of science, with frequent success.
However, a problem with the frequentist definition of probability is that it can’t assign a probability to unique events since they cannot be repeated. Yet in an informal way, people do assign such probabilities, so it would be desirable for a statistical theory to be able to deal with them. Frequentism gets around that by thinking of a “frame of reference”, that is, assuming that similar events can be thought to at least approximately come from the same “random experiment” (Thus, a frequentist may answer the election question by looking at past, similar elections). Theoretical rigor is abandoned in favor of applicability.
A similar problem arises when one wishes to think about the likelihood of an unknown quantity, or the truth of a statement about the past or present. For example, the likelihood that a hypothesis is true. Such a likelihood is impossible to measure for frequentist statistics, so when the question (central in science) is posed “How likely is it that this hypothesis is true, given these data?”, a very theoretically weak technique is used: the p-value.
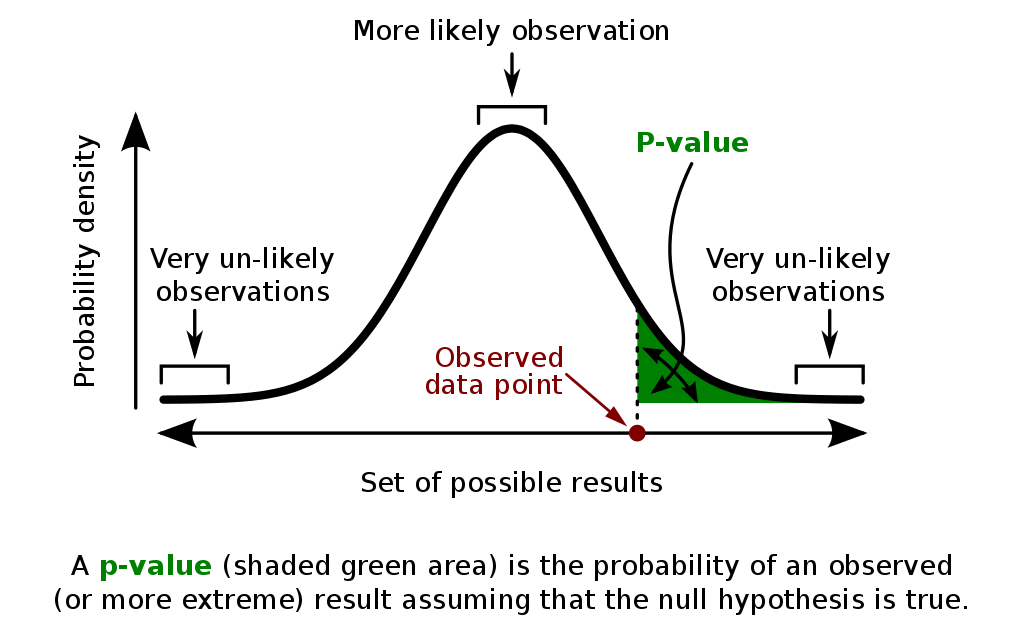
A graphical explanation of the p-value (Credit: Repapetilto & Chen-Pan Liao @ Wikipedia)
The p-value can be (inaccurately) thought of as the answer to the question “How likely would be the data I collected, given that my hypothesis was wrong?”, the idea being that if it is really small, then maybe the hypothesis is true. Clearly, the two questions are not the same, yet most p-value users equate them. To explain the exact nature of the error here, an important theorem in probability is needed, which I will discuss soon.
Supervised Learning and its Limitations
A different approach can be taken, which assumes little to nothing about the nature of uncertainty and probability, and instead focuses its effort on producing the best prediction possible for a given task. This is the focus of supervised learning (SL), a type of machine learning (ML), which focuses on predicting a response variable y given a set of input variables (AKA features) x, observed on a dataset.
Mathematically, SL algorithms are trying to estimate the expected value of the response variable given the input variables, as a function of them, by adjusting parameters through observations of these variables. Many powerful methods have been devised to perform this task, and one must choose among a diversity of them depending on the nature of variables, dimensionality, and complexity of the phenomena which produces the data, among other things.
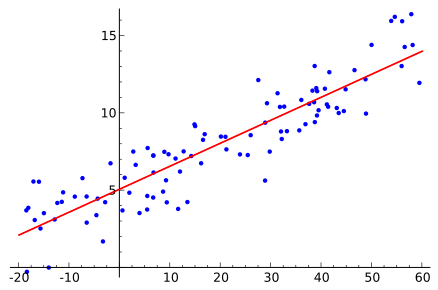
An example of an SL task, solved by Linear Regression (Credit: Sewaqu)
Because they are designed to do well on this problem, SL algorithms typically can’t deal with another type of questions. For example, one might wish to ask, given the input variables, how likely is it that the response rises above a given threshold. While this is a question that can be typically answered with a statistical model, not every ML model has a straightforward way to do it, and it is simply impossible for many.
Another problem that arises frequently when using some SL algorithms is the difficulty in interpreting their results. Take, for example, the multilayer perceptron, with many layers, an activation function per neuron (usually, per layer) and a lot of weights, it becomes quite difficult to explain what each parameter means, or pinpoint how a change in one of the inputs affects the response. Predictive power, in this case, comes at the cost of having to use the model as a sort of black box, its only task is to give out predictions, without context or interpretability.
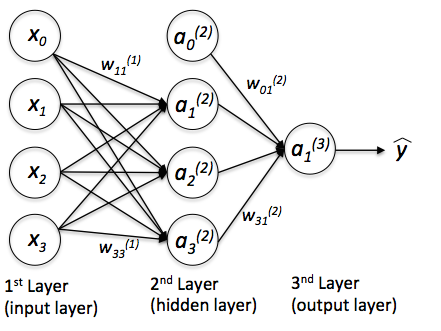
A multilayer perceptron (Credit: Sebastian Raschka)
When we use predictive models as black boxes, without being aware of the assumptions they make about the data and the phenomenon, we risk falling into overcertainty. Since we know our predictions to be accurate (it is not uncommon for an ML algorithm to rise above 90% accuracy), but we don’t exactly know the inner workings of them, we tend to trust them completely, much as if they were oracles, and make decisions taking for granted their predictions.
Some examples of the consequences of overcertainty:
A way to deal with overcertainty is to account for uncertainty, measuring and presenting it instead of reducing and hiding it, and a great framework to do this is known as Bayesian Statistics.