By Derrick Mwiti, Data Analyst

Pandas is an open source data structures and data analysis tool for python programming. As we saw from this article Python is the most popular data science language to learn in 2018. The name Pandas is derived from the word Panel Data — an Econometrics from Multidimensional data. This tutorial will offer a beginner guide into how to get around with Pandas for data wrangling and visualization.
Import Pandas
We start by importing pandas and aliasing it as pd to give us a shorthand to use in our analysis.
import pandas as pd
Loading the data
Pandas allows you to import files in various formats. The most popular format is CSV.
The first step is to assign the file you are going to load to a variable in order to be able to manipulate the data frame later in your analyses. A data frame is basically the representation of the rows and columns in your dataset
For A csv file
df = pd.read_csv(‘pathtoyourfile.csv’)
For An Excel File
df = pd.read_excel(‘pathtoyourfile.xlsx’, sheetname=’nameofyoursheet’)
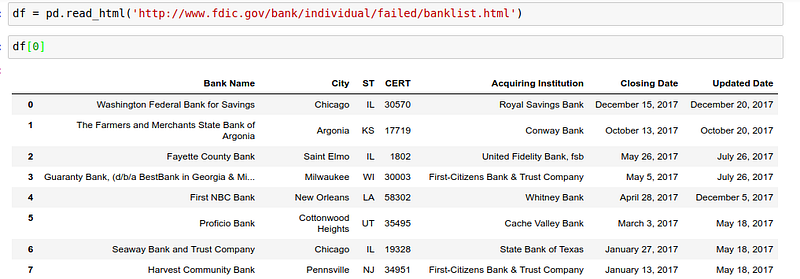
Reading an online HTML file
Pandas can also read off HTML tables online using the following command
df = pd.read_html(‘linktoonlinehtmlfile’)
You might need to install the following packages for this to work
pip install Beautifulsoup htmllib5 lxml
To illustrate some of the things you can do with pandas we shall use tweetsfrom major incubators that I collected for the year 2017.
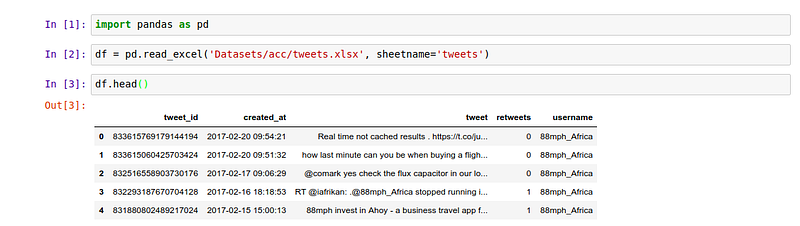
To view the first five items we call the head command on the dataset. Similarly to view the last five elements in the dataset we use the tail function. It is usually important to check the data type of the columns as well as if there are null values. This can be achieved using the info command.
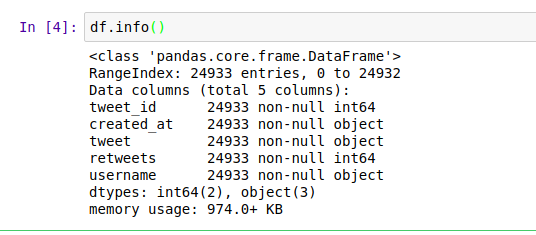
From this we can be able to tell that our dataset has 24933 entries, 5 columns and they are all non null. This will not always be case. In the event that some of the rows are null we would have to deal with them appropriately depending on the situation at hand. One way is to drop them and the other way is to fill them. Let’s assume that we had a agecolumn in our dataset representing the age of the person who sent out the tweet. We would fill it with the mean as follows
df[‘age’].fillna(value=df[‘age’].mean())
We could also decide to drop them this way
df.dropna()and this will drop all columns with null values. Dealing with null values is very important because it can affect the kind of insights that you draw from the data.
You can also use this method to check for null values
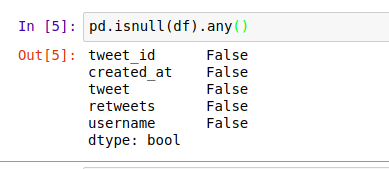
As we saw earlier this dataset has no null values.
Group By
We might want to group all our tweets by the username and count the number of tweets each organization had. We might also be interested in seeing the top 10 organizations with most tweets.
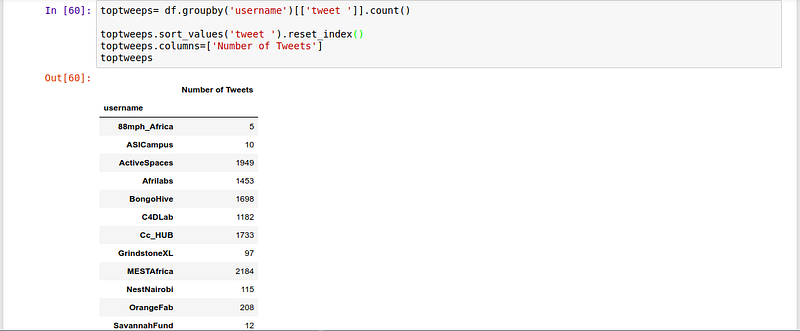
We use Sort_values to sort the data frame by the number of tweets.
Sum
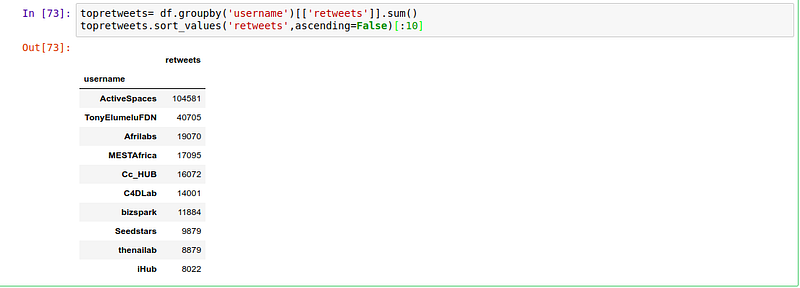
Since all organizations have retweets let’s find out which organization had the most retweets. We can achieve this by grouping the tweets by the username of the organization and summing the retweets.