Data science is one of the hottest topics in the 21st century because we are generating data at a rate which is much higher than what we can actually process. A lot of business and tech firms are now leveraging key benefits by harnessing the benefits of data science. Due to this, data science right now is really booming.
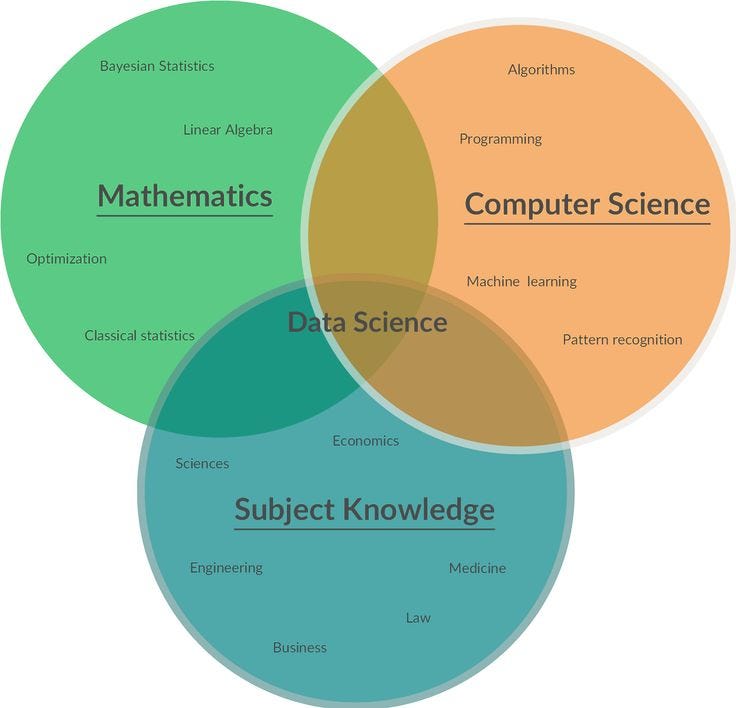
Data science is an amalgamation of three different fields namely
-
Computer Science
-
Mathematics
-
Business Knowledge
Starting from this article, We at Dimensionless will be helping you to kick-start your data science career if you are from one of the fields above or even not from them at all.
You may have seen those memes which talk about your engineering/high school maths not being used anywhere in the real world. This won’t be the case henceforth though.
Today, we will talk about what are different things you should learn in mathematics for becoming a data scientist. This will not be so difficult for you too because we at Dimensionless Technologies have all the right courses for you to kick-start your success journey.

Dimensionless Tech provides best online data science training that provides in-depth course coverage, case study based learning, entirely Hands-on driven sessions with Personalised attention to every participant. As a result, we guarantee Learning.
Dimensionless has courses which are well-tailored for the beginners to understand the data science as a whole. This course takes into the account the importance of having math knowledge hence we start with learning statistic itself.
We provide only instructor-led LIVE online training sessions. Above all, the interactivity level is similar to classroom training and you get it in the comfort of your home. If you miss any class or didn’t understand some concepts, you can go through the classes again as we provide you with recordings of each class.
-
Finding immediate insights out of dataWe use descriptive statistics here to gather immediate information about the data at hand. For example, in a house price dataset, we can find out the in Region X has the most number of expensive houses.
-
Inferencing from data and validating itWe use inferential statistics to infer about our findings from data. On finding maximum house price at a region X, we formulate some hypothesis on why prices are higher in that region. After forming hypotheses, we check their validity using hypothesis tests
-
Making predictions from dataMachine learning and math is one of the greatest love stories. These algorithms are a mix of logic and a lot of maths. Hence understanding the math behind may result in you appreciating it furthermore
If you’ve just entered the word of Data Science, you might have come across people stating “Math” as a prerequisite to Data Science. In all honesty, it’s not Maths, rather Statistics that’s a major prerequisite for Data Science.
Well, statistics is something which is present everywhere in the data science field. Hence, you surely can not be a good data scientist without knowing and understanding statistics well enough. But, Dimensionless has come up with the great courses which talk about the in-depth understanding of statistics and their applications.
These days, libraries like Tensorflow hide almost all the complex Mathematics away from the user. Good for us, but it’s still good to have a basic understanding of the underlying principles on which these things work because having a general understanding of basic statistics for Data Science can help you utilize these libraries better.
Types of Statistics
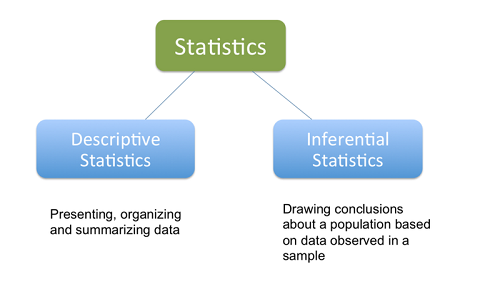
Descriptive Statistic
First of all, doing a descriptive statistical analysis of your dataset is absolutely crucial. A lot of people skip this part and therefore lose a lot of valuable insights about their data, which often leads to wrong conclusions. Take your time and carefully run descriptive statistics and finally make sure that the data meets the requirements to do further analysis.
We use descriptive statistics for data exploration because it provides simple summaries of the dataset. Together with graphics analysis, this is the first step in every data analysis.
A small peek of what we have in the course by understanding about central tendency
In statistics, we have to deal with the mean, mode, and the median. These are also called the Central Tendency. These are just three different kinds of averages and certainly the most popular ones.
The mean is simply the average and considered the most reliable measure of central tendency for making assumptions about a population from a single sample. Central tendency determines the tendency for the values of your data to cluster around its mean, mode, or median. We calculate median by the sum of all values, divided by the number of values.
The mode is the value or category that occurs most often within the data.Therefore a dataset has no mode, if no number is repeated or if no category is the same. The mode is also the only measure of central tendency that can be used for categorical variables since you can’t compute for example the average for the variable gender. You simply report categorical variables as numbers and percentages.
The median is the “middle” value or midpoint in your data.Note that outliers affect do not affect median much as compared to mean. Let us take an example here: Imagine you have a dataset of housing prizes that range mostly from Rs 10,00,000 to Rs 70,00,000 but contains a few houses that are worth more than 70 lakhs. These expensive houses will heavily effect then mean since it is the sum of all values, divided by the number of values. The outliers will not affect the median much since it is only the “middle” value of all data points. Therefore the median is a much more suited statistic, to report about your data.
This is just a small peek of what you will be learning in descriptive stats. All the topics are taught in the order which well help learner form mind maps of different concept connected to each other and have a strong grasp over them.
The course content includes (link)
-
Intro to Research Methods
-
Visualizing Data
-
Central Tendency
-
Variability
-
Standardizing
-
Normal Distribution
-
Sampling Distributions
Inferential Statistic
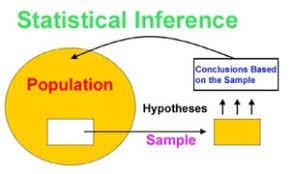
With inferential statistics, you are trying to reach conclusions that extend beyond the immediate data alone. For instance, we use inferential statistics to try to infer from the sample data what the population might think. Or, we use inferential statistics to make judgments of the probability that an observed difference between groups is a dependable one or one that might have happened by chance in this study. Thus, we use inferential statistics to make inferences from our data to more general conditions; we use descriptive statistics simply to describe what’s going on in our data.
Inferential Statistics contents include (link)
-
Estimation (Point estimate and Interval estimate)
-
Hypothesis Testing
-
t-tests (One Sample, Two Sample Dependent, Two-sample Independent)
-
ANOVA
-
Correlation
-
Regression
-
Chi-square Test
Apart from probability and statistics, Our courses include an in-depth explanation of machine learning algorithms by going deeper into the math. There has been a lot of booms lately in the field of machine learning and deep learning. With our up-to-date courses, we give you the essence of maths required to understand machine learning in great detail. We have covered topics like linear algebra, regression and the math behind different machine learnings algorithms exhaustively.
Course for Deep Learning: Link
Course for Data Science with R and Python: Link