Think of this as a standard Jupyter Notebook with slightly different aesthetics. You can write Python code and text (using Markdown syntax) just like in Jupyter and run the code completely in the cloud on Kaggle’s servers. However, Kaggle kernels have some unique features not available in Jupyter Notebook. Hit the leftward facing arrow in the upper right to expand the kernel control panel which brings up three tabs (if the notebook is not in fullscreen, then these three tabs may already be visible next to the code).
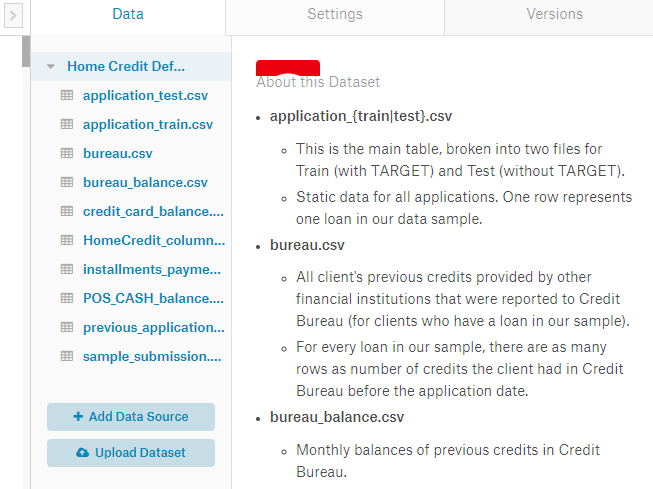
In the data tab, we can view the datasets to which our Kernel is connected. In this case, we have the entire competition data, but we can also connect to any other dataset on Kaggle or upload our own data and access it in the kernel. Data files are available in the ../input/ directory from within the code:

The Settings tab lets us control different technical aspects of the kernel. Here we can add a GPU to our session, change the visibility, and install any Python package which is not already in the environment.
Finally, the Versions tab lets us see any previous committed runs of the code. We can view changes to the code, look at log files of a run, see the notebook generated by a run, and download the files that are output from a run.
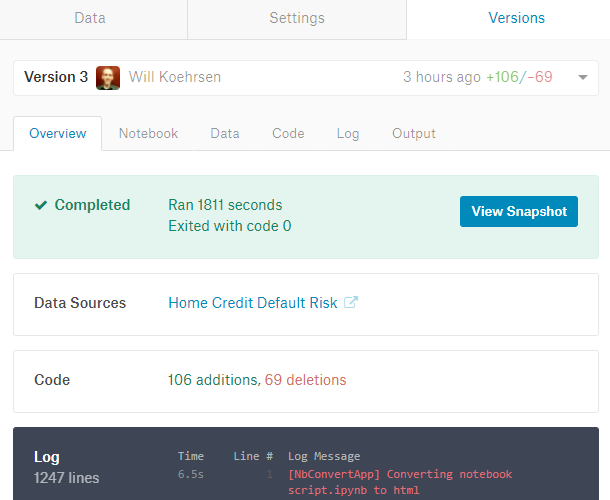
Versions Tab To run the entire notebook and record a new Version, hit the blue Commit & Run button in the upper right of the kernel. This executes all the code, shows us the completed notebook (or any errors if there are mistakes), and saves any files that are created during the run. When we commit the notebook, we can then access any predictions our models made and submit them for scoring.
Introductory Notebook Outline
The first notebook is meant to get you familiar with the problem. We start off much the same way as any data science problem: understanding the data and the task. For this problem, there is 1 main training data file (with the labels included), 1 main testing data file, and 6 additional data files. In this first notebook, we use only the main data, which will get us a decent score, but later work will have to incorporate all the data in order to be competitive.
To understand the data, it’s best to take a couple minutes away from the keyboard and read through the problem documentation, such as the column descriptions of each data file. Because there are multiple files, we need to know how they are all linked together, although for this first notebook we only use the main file to keep things simple. Reading through other kernels can also help us get familiar with the data and which variables are important.
Once we understand the data and the problem, we can start structuring it for a machine learning task This means dealing with categorical variables (through one-hot encoding), filling in the missing values (imputation), and scaling the variables to a range. We can do exploratory data analysis, such as finding correlations with the label, and graphing these relationships.
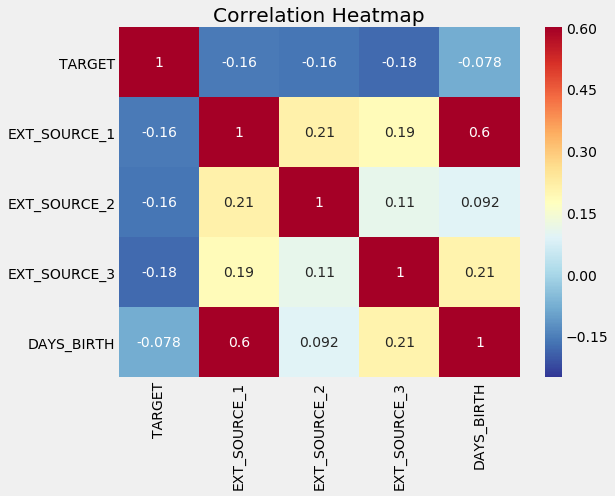
Correlation Heatmap of Variables We can use these relationships later on for modeling decisions, such as including which variables to use. (See the notebook for implementation).