I’ve just had the privilege of giving my first keynote at EuroPython (and my second keynote this year), I’ve just spoken on “Citizen Science”. I gave a talk aimed at engineers showing examples of projects around healthcare and humanitarian topics using Python that make the world a better place. The main point was “gather your data, draw graphs, start to ask questions” – this is something that anyone can do:
NOTE that this write-up will evolve over a few days, I have to add the source code and other links later.
In the talk I covered 4 short stories and then gave a live demo of a Jupyter Lab to graph some audience-collected data:
-
Gorjan‘s talk on Macedonian awful-air-quality from PyDataAmsterdam 2018
-
My talks on solving Sneeze Diagnosis given at PyDataLondon 2017, ODSC 2017 and elsewhere
-
Anna‘s talk on improving baby-delivery healthcare from PyDataWarsaw 2017
-
Dirk‘s talk on saving Orangutangs with Drones from PyDataAmsterdam 2017
-
Jupyter Lab demo on “guessing my dog’s weight” to crowd-source guesses which we investigate using a Lab
The goal of the live demo was to a) collect data (before and after showing photos of my dog) and b) show some interesting results that come out of graphing the results using histograms so that c) everyone realises that drawing graphs of their own data is possible and perhaps is something they too can try. Whilst having folk estimate my dog’s weight won’t change the world, getting them involved in collecting and thinking about data will, I hope, get more folk engaged outside of the conference.
The slides are here.
Here’s some output. Approximately 440 people participated in the two single-answer surveys. The first (poor-information estimate) is “What’s the weight of my dog in kg when you know nothing about the dog?” and the second (good-information estimate) is “The same, but now you’ve seen 8+ pictures of my dog”.
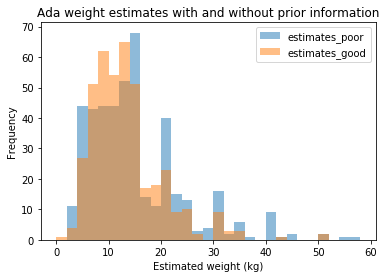
With poor information folk tended to go for the round numbers (see the spikes at 15, 20, 30, 35, 40). After the photos were shown the variance reduced (the talk used more graphs to show this), which is what I wanted to see. Ada’s actual weight is 17kg so the “wisdom of the crowds” estimate was off, but not terribly so and since this wasn’t a dog-fanciers crowd, that’s hardly surprising!
Before showing the photos the median estimate was 12.85kg (mean 14.78kg) from 448 estimates. The 5% quantile was 4kg, 95% quantile 34kg, so 90% of the estimates had a range of 30kg.
After showing the photos the median estimate was 12kg (mean 12.84kg) from 412 estimates. The 5% quantile was 5kg, 95% quantile 25kg, so 90% of the estimates had a range of 20kg.
There were only a couple of guesses above 80kg before showing the photos, none after showing the photos. A large heavy dog can weight over 100kg so a guess that high, before knowing anything about my dog, was feasible.
Around 3% of my audience decided to test my CSV parsing code during my live demo (oh, the wags) with somewhat “tricky” values including “NaN”, “None”, “Null”, “Inf”, “∞”, “-15”, “⁴4”, “1.00E+106”, “99999999999”, “Nana”, “1337” (i.e. leet!), “1-30”, “+[[]]” (???). The “show the raw values in a histogram” cell blew up with this input but the subsequent cells (using a mask to select only a valid positive range) all worked fine. Ah, live demos.
The slides conclude with two sets of links, one of which points the reader at open data sources which could be used in your own explorations.