Today I noticed an op-ed by two political scientists, Howard Lavine and Wendy Rahm, entitled, “What if Trump’s Nativism Actually Hurts Him?”:
Contrary to received wisdom, however, the immigration issue did not play to Mr. Trump’s advantage nearly as much as commonly believed. According to our analysis of national survey data from the American National Election Studies (a large, representative sample of the population of the United States), Hillary Clinton did better in the election than she would have if immigration had not been so prominent an issue. . . .
Hmmmm, that’s a surprise. I wonder whassup with that? They online version features a couple graphs:
And here’s some corresponding text in the op-ed, following the principle that a picture and a thousand words are better than two pictures or 2000 words:
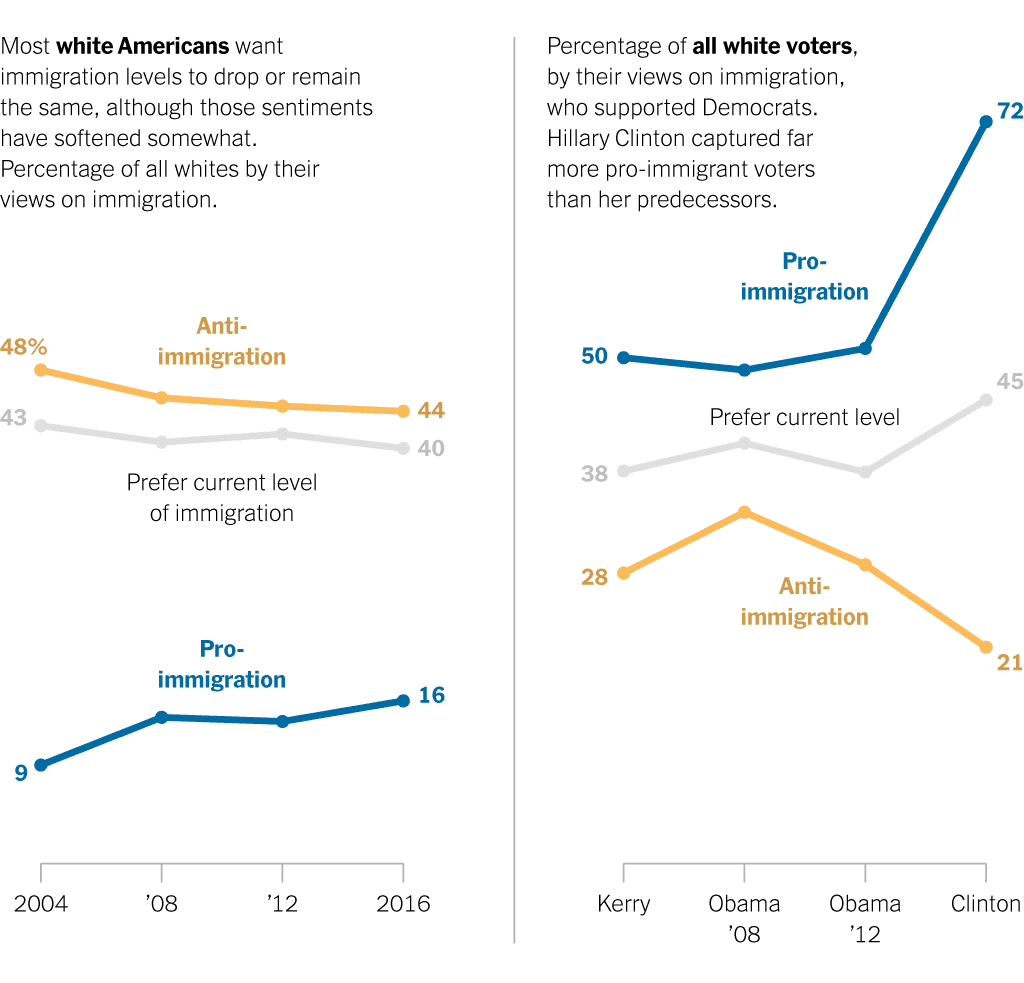
We found that Mr. Trump did only slightly better than his Republican predecessors among anti-immigration whites. Among pro-immigration whites, however, Mrs. Clinton far outpaced John Kerry in 2004 and Barack Obama in 2008 and 2012. For example, Mr. Obama received the votes of 50 percent of pro-immigration whites in 2012, whereas Mrs. Clinton won the votes of 72 percent of that group in 2016 — a 22-point difference. Among anti-immigration whites, by contrast, Mr. Trump improved only marginally on Mitt Romney’s showing, 79 percent to 71 percent. Perhaps most important — given the popularity of the “keep the same” position — is that immigration moderates swung 7 percentage points in Mrs. Clinton’s favor (Mr. Obama received 38 percent to Mrs. Clinton’s 45). . . .
Now I was curious, so I thought I’d check the numbers. According to the above graph, everyone is in one of the three categories of immigration attitudes (44% + 40% + 16% = 100%), so we can just take a weighted average to compute Hillary Clinton’s support among white voters in 2016:
whites for Clinton in 2016: .44.21 + .40.45 + .16*.72, which comes to 0.3876, that is, 39%.
And we can carefully read off the graph and do the same for 2012:
whites for Obama in 2012: .45.29 + .42.38 + .13*.50 = 0.3551, that’s 36%.
So, if you believe these numbers, then Clinton in 2016 did 3 percentage points better than Obama in 2012 among white voters.
What really happened? I don’t really know; all we have are surveys. Here’s what the exit polls say (here and here):


Taking total vote share, the exit polls have Clinton in 2016 doing 2 percentage points worse than Obama in 2012. As a proportion of two-party vote, their shares are almost identical, within rounding error (39.4% for Clinton, 39.8% for Obama).
I could be doing something wrong here—or maybe I’m just making a mistake trusting the exit polls here. But if we do believe that Clinton did worse, or no better than, Obama among white voters, then the numbers in that NYT op-ed just don’t add up.
In particular, there seems to be something wrong with the calculation, derived from the above graphs, that Obama had only 36% support among whites in 2012, given that the exit polls gave him 39% and our MRP analysis gave him 41% of the white vote in that year.
To say it another way: the op-ed’s conclusions are driven by two striking pattern in the above graph: the jump in Democratic support among pro-immigration voters, from 50% in 2012 to 72% in 2016, and the smaller but still substantial increase in Democratic support among immigration neutrals, from 38% to 45%. But these numbers imply that Clinton outperformed Obama by 3 percentage points among white voters—not a claim I’ve seen anywhere else.
And I’m not convinced by the claim in the op-ed that “Hillary Clinton did better in the election than she would have if immigration had not been so prominent an issue.”
So what happened with those goofy numbers? The researchers worked with a single survey, and surveys have sampling error. When, after an election is over, you use a survey to summarize election results, standard practice is to adjust to match the sample with the known vote totals: that’s what the exit polls do, and that’s what we do too. If you don’t make that adjustment, you get numbers that don’t add up to what actually happened.
Or maybe I just messed something up in my calculations. That’s an advantage of blogging—if I get something wrong, one of you is likely to correct me. A newspaper op-ed just sits there, with no one really taking responsibility for its correctness. This one looks so wrong, that I do think there’s a good chance that I’m just missing something obvious. If so, please let me know.