D3.js is a JavaScript library used to manipulate documents based on data. It uses HTML, CSS, and SVG to create visual representations of data which can be viewed on any modern browser.
It also provides some awesome features for interactions and animations.
In this tutorial, we will explore the basic concepts and features of D3.js. We’ll learn how to use it with the help of few examples like rendering a bar chart, rendering HTML and SVG elements, and applying transformations and events to them.
We’ve also created a free 10-part course on D3.js on Scrimba. Check it out here.
Getting started with D3
As D3.js is a JavaScript library, you can simply include it in your HTML file inside a script tag.
1 | |
The full source and tests are also available for download on GitHub.
DOM Selection
Using D3.js, we can manipulate the Document Object Model (DOM), meaning we can select elements and apply various transformations on them.
Let’s start off with a simple example, where we’ll be using D3 to select and change the color and the font size of a heading tag.
1 | |
So we’re simply chaining the select() method on the d3 object, and then following up with style(). The first parameter dictates what we want to change and the second gives the value. Here’s the result:
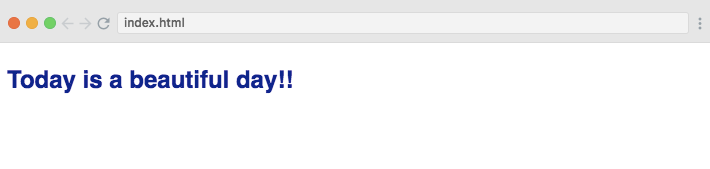 Example 1: DOM Selection
Data Binding
The next concept you’ll need to learn is data binding, as that’s one of the coolest features of D3. Using it, we can populate or manipulate DOM elements in real-time.
In our HTML, we have a simple unordered list <ul>:
1 | |
We want to create the list elements using a data object. Here’s the code for doing exactly that:
1 | |
In our JavaScript code above, D3 first selects the <ul> and any <li>elements inside it using select() and selectAll() methods. It might seem a bit weird that we’re selecting all li elements before we’ve created them, but that’s just how D3 works.
We then pass in the data with the data() method, and add enter(), which works kind of like a loop. Everything after this point will be executed once per item in the fruits array.
In other words, it then appends an<li>for every item in data. For every <li>tag, it also appends text inside it using the text() method. The parameter d inside the text() callback function refers to the element in the array at the given iteration (apple, mango, and so on).
So here’s our final result:
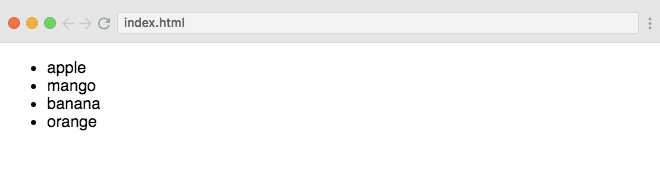 Example 2: Data Binding
Creating SVG Elements
Scalable Vector Graphics (SVG) is a way to render graphical elements and images in the DOM. As SVG is vector-based, it’s both lightweight and scalable. D3 uses SVG to create all its visuals, and therefore it is a core building block of the library.
Here in the example below, a rectangle is being drawn using D3 in an SVG container.
1 | |
In this code, D3 is rendering a rectangle element inside the DOM. It first selects the SVG element and then renders a rectangle element inside it. It also sets x and y coordinates of the rectangle along with its width, height, and fill properties using the attr() method.
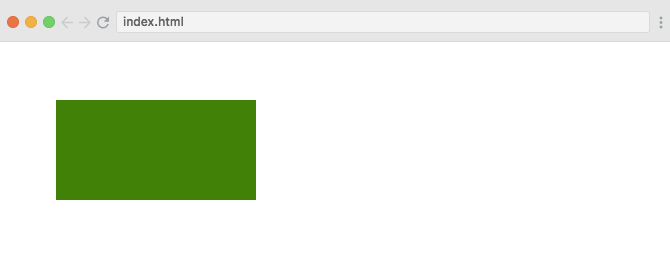 Example 3: Creating SVG Element
Creating a Bar Chart
D3 also lets us create a lot of different types of charts and graphs to represent data in efficient ways. In the example below, we are creating a simple bar chart using D3.
Let’s start out by creating an SVG tag directly in our HTML.
1 | |
Then, we’ll write the JavaScript we need in order to render the bar chart in our <svg> tag:
1 | |
In this code, we have an array of numbers which we will use to render our bar chart. Each item in an array would represent a single bar. We make use of the fact that bars are just rectangles with variable width or height.
After selecting the SVG and rectangle elements, we pass our dataset using the data() method and call enter() to start looping on data.
For each data item, we render a rectangle and set its width equivalent to its value. We then set the height of each bar, and to avoid overlapping, we provide some padding to it by subtracting 1 from barHeight.
We then transform our bars using the translate property which will position every rectangle one after another rather than starting from the same point. transform() takes a callback function which gets data and index in its parameters. We translate the rectangle on the y-axis, by multiplying index with the height of the bar.
Here’s the result:
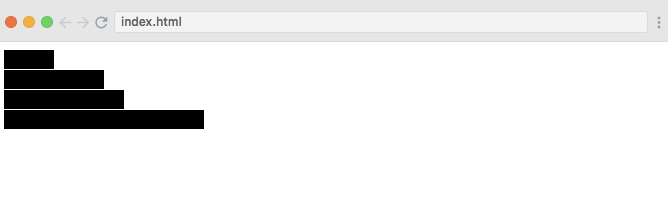 Example 4: Creating Bar Chart
Event Handling
Finally, let’s also look at event handling. D3 also supports built-in and custom events which we can bind to any DOM element with its listener. In the example below, we are binding the click event to the button and appending a heading tag to a body in its event handler.
1 | |
So when we click the button, the text below appears:
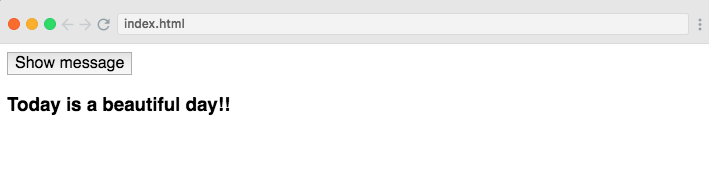 Example 5: Event Handling
Conclusion
D3.js is a very powerful, yet simple, JavaScript library that allows you to play with and bring life to documents based on data using HTML, CSS, and SVG.
There are a lot of good resources available online to learn D3.js. There is a free course on D3.js which we have created on Scrimba and is available for free here.
Thank you 
*I am Sohaib Nehal. I am a Full-Stack Web Application Developer. You can reach me at sohaib.nehal@ymail.com or on Twitter @Sohaib_Nehal. Thank you
*