For the past few months, I’ve been playing Madden NFL 17 in my free time. I really enjoy the team-building aspect of the franchise mode, where I’ve taken on challenges such as finally bringing the Lombardi trophy home to Philadelphia.
As a data nerd, one thing I love about Madden NFL is their player rating system, where they assign numerical values to practically every aspect of every player’s abilities. These ratings are then summarized into an overall player rating (OVR for short), which is a fairly good indication of how skilled a player is and how dominant they will be on the football field.
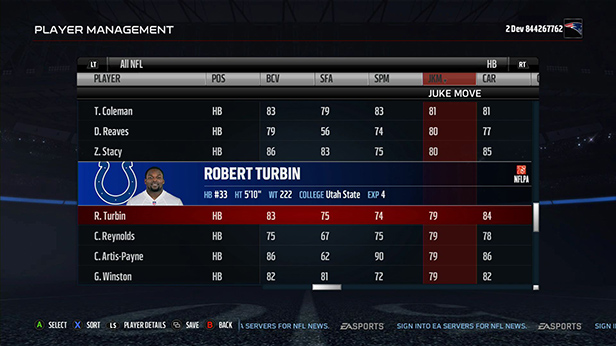 Image courtesy of EA Sports
A couple years ago, FiveThirtyEight published a great data-driven feature explaining how Madden NFL’s player ratings are made, and how essentially one person is behind the whole system. Perhaps most useful for Madden NFL players, they provided a chart showing the most important traits for each position in the game. A lot has changed in the past couple years, though, and for the longest time I’ve wanted to figure out the “master equation” that actually turns player ratings into their overall rating so I know what traits to focus on developing. That’s the goal of this post, where I’m going to use machine learning to attempt to discover that “master equation.”
If you don’t care about how I computed the ratings, feel free to skip ahead to the “master equation” section.
Analyzing Madden NFL player ratings
The Madden NFL folks have been pretty awesome about sharing their player rating data. We can look up and download all of the active player ratings directly from the Madden NFL web site, which I’ve done and shared in a Google doc here. For this post, I’m working with the preseason ratings.
Since no analysis is complete without some basic exploratory data analysis, let’s take a look at the distribution of overall player ratings, which is what we’re looking to model. The chart below is a violin plot, which is a combination of a box plot and histogram. Basically, it shows the distribution of Madden player OVRs.

Madden player OVRs range from 40 (worst) to 99 (best), with a majority of the players falling between 65 and 75 OVR. Only a handful of players fall into the coveted 99 rating spot, which include current NFL greats such as Patriots TE Rob Gronkowski (when he’s healthy) and Broncos linebacker Von Miller (the highest paid defensive player in NFL history). There’s an interesting blip of players in the low-40s OVR range, which are better highlighted when we break down the OVRs by position:

All of the players rated in the low 40s OVR are TEs, which seems quite odd. Do NFL coaches like to hoard crappy TEs? Why would professional football teams keep players who are rated so poorly that they’re statistical anomalies (in a bad way) when compared to the rest of the NFL?
After a little digging into the player rating spreadsheet, it seems that nearly all of these low-40s OVR TEs are actually long snappers, and the Madden NFL folks decided to make them TEs for some reason. Since Madden NFL doesn’t currently feature long snappers nor a long snapping skill, my guess is that most of these long snappers don’t even make the preseason cuts in most Madden games.
Another interesting finding from the above chart is that kickers and punters tend to have the highest OVR, on average. This is likely because there’s so few kickers and punters in the league (typically, only one of each per team), and few teams (except for the 2016 Buccaneers) keep a kicker or punter around if they don’t excel at their job.
There are many more interesting statistics to look at in this data set, but in the interest of brevity, I’ll leave those charts for another post.
Finding the master equations
Now that we have a basic understanding of the data set, we want to find the “master equation” that turns player skill ratings into their OVR, which represents how good of a player they are in Madden.
To accomplish this goal, I trained a linear model (with Lasso regularization) to predict every player’s OVR based on their skill ratings. Essentially, I gave the model every player’s skill ratings (speed, strength, throw power, etc.) and asked it to predict each player’s OVR for me.
Since each position’s OVR is calculated differently—throw power is far more important for quarterbacks than defensive tackles, for example—I grouped the players by their position and trained a different linear model for each position. Thus, we’re no longer looking for a master equation; we’re looking for the master equations.
One of the main advantages of linear models is their interpretability. Once a linear model is trained on a data set, we can inspect the model, which is simply a sum of the player skill ratings with weights applied to them. For example, maybe the QB master equation would look like:
QB OVR = 10 + 0.5 x Throw Power + 0.25 x Throw Accuracy Short + 0.2 x Throw Accuracy Medium + 0.1 x Throw Accuracy Deep
So if we want to calculate Tom Brady’s OVR, we would plug his ratings into the equation:
Tom Brady OVR = 10 + 0.5 x 94 + 0.25 x 98 + 0.2 x 98 + 0.1 x 84 = … and so on.
Obviously the above equation was made up, but let’s take a look at the master equations that the linear models discovered.
The master equations Below, I made a heatmap of the player traits that affect each position’s OVR. Darker purple cells indicate important traits for the position, whereas light purple or blank traits have little to no effect. The number in each cell is the linear model’s coefficient, which is the number that’s multiplied by the trait in the master equation.

Here are the intercepts for each linear model:
| Position | Intercept |
| QB | -67.83 |
| HB | -62.34 |
| FB | -76.59 |
| WR | -52.84 |
| TE | -61.99 |
| LT | -43.45 |
| LG | -55.1 |
| C | -56.83 |
| RG | -52.97 |
| RT | -44.89 |
| LE | -69.02 |
| DT | -61.49 |
| RE | -63.67 |
| LOLB | -49.92 |
| MLB | -56.68 |
| ROLB | -50.14 |
| CB | -54.81 |
| SS | -47.58 |
| FS | -45.75 |
| K | 0.72 |
| P | 1.64 |