Instagram Activity Normalized for Population
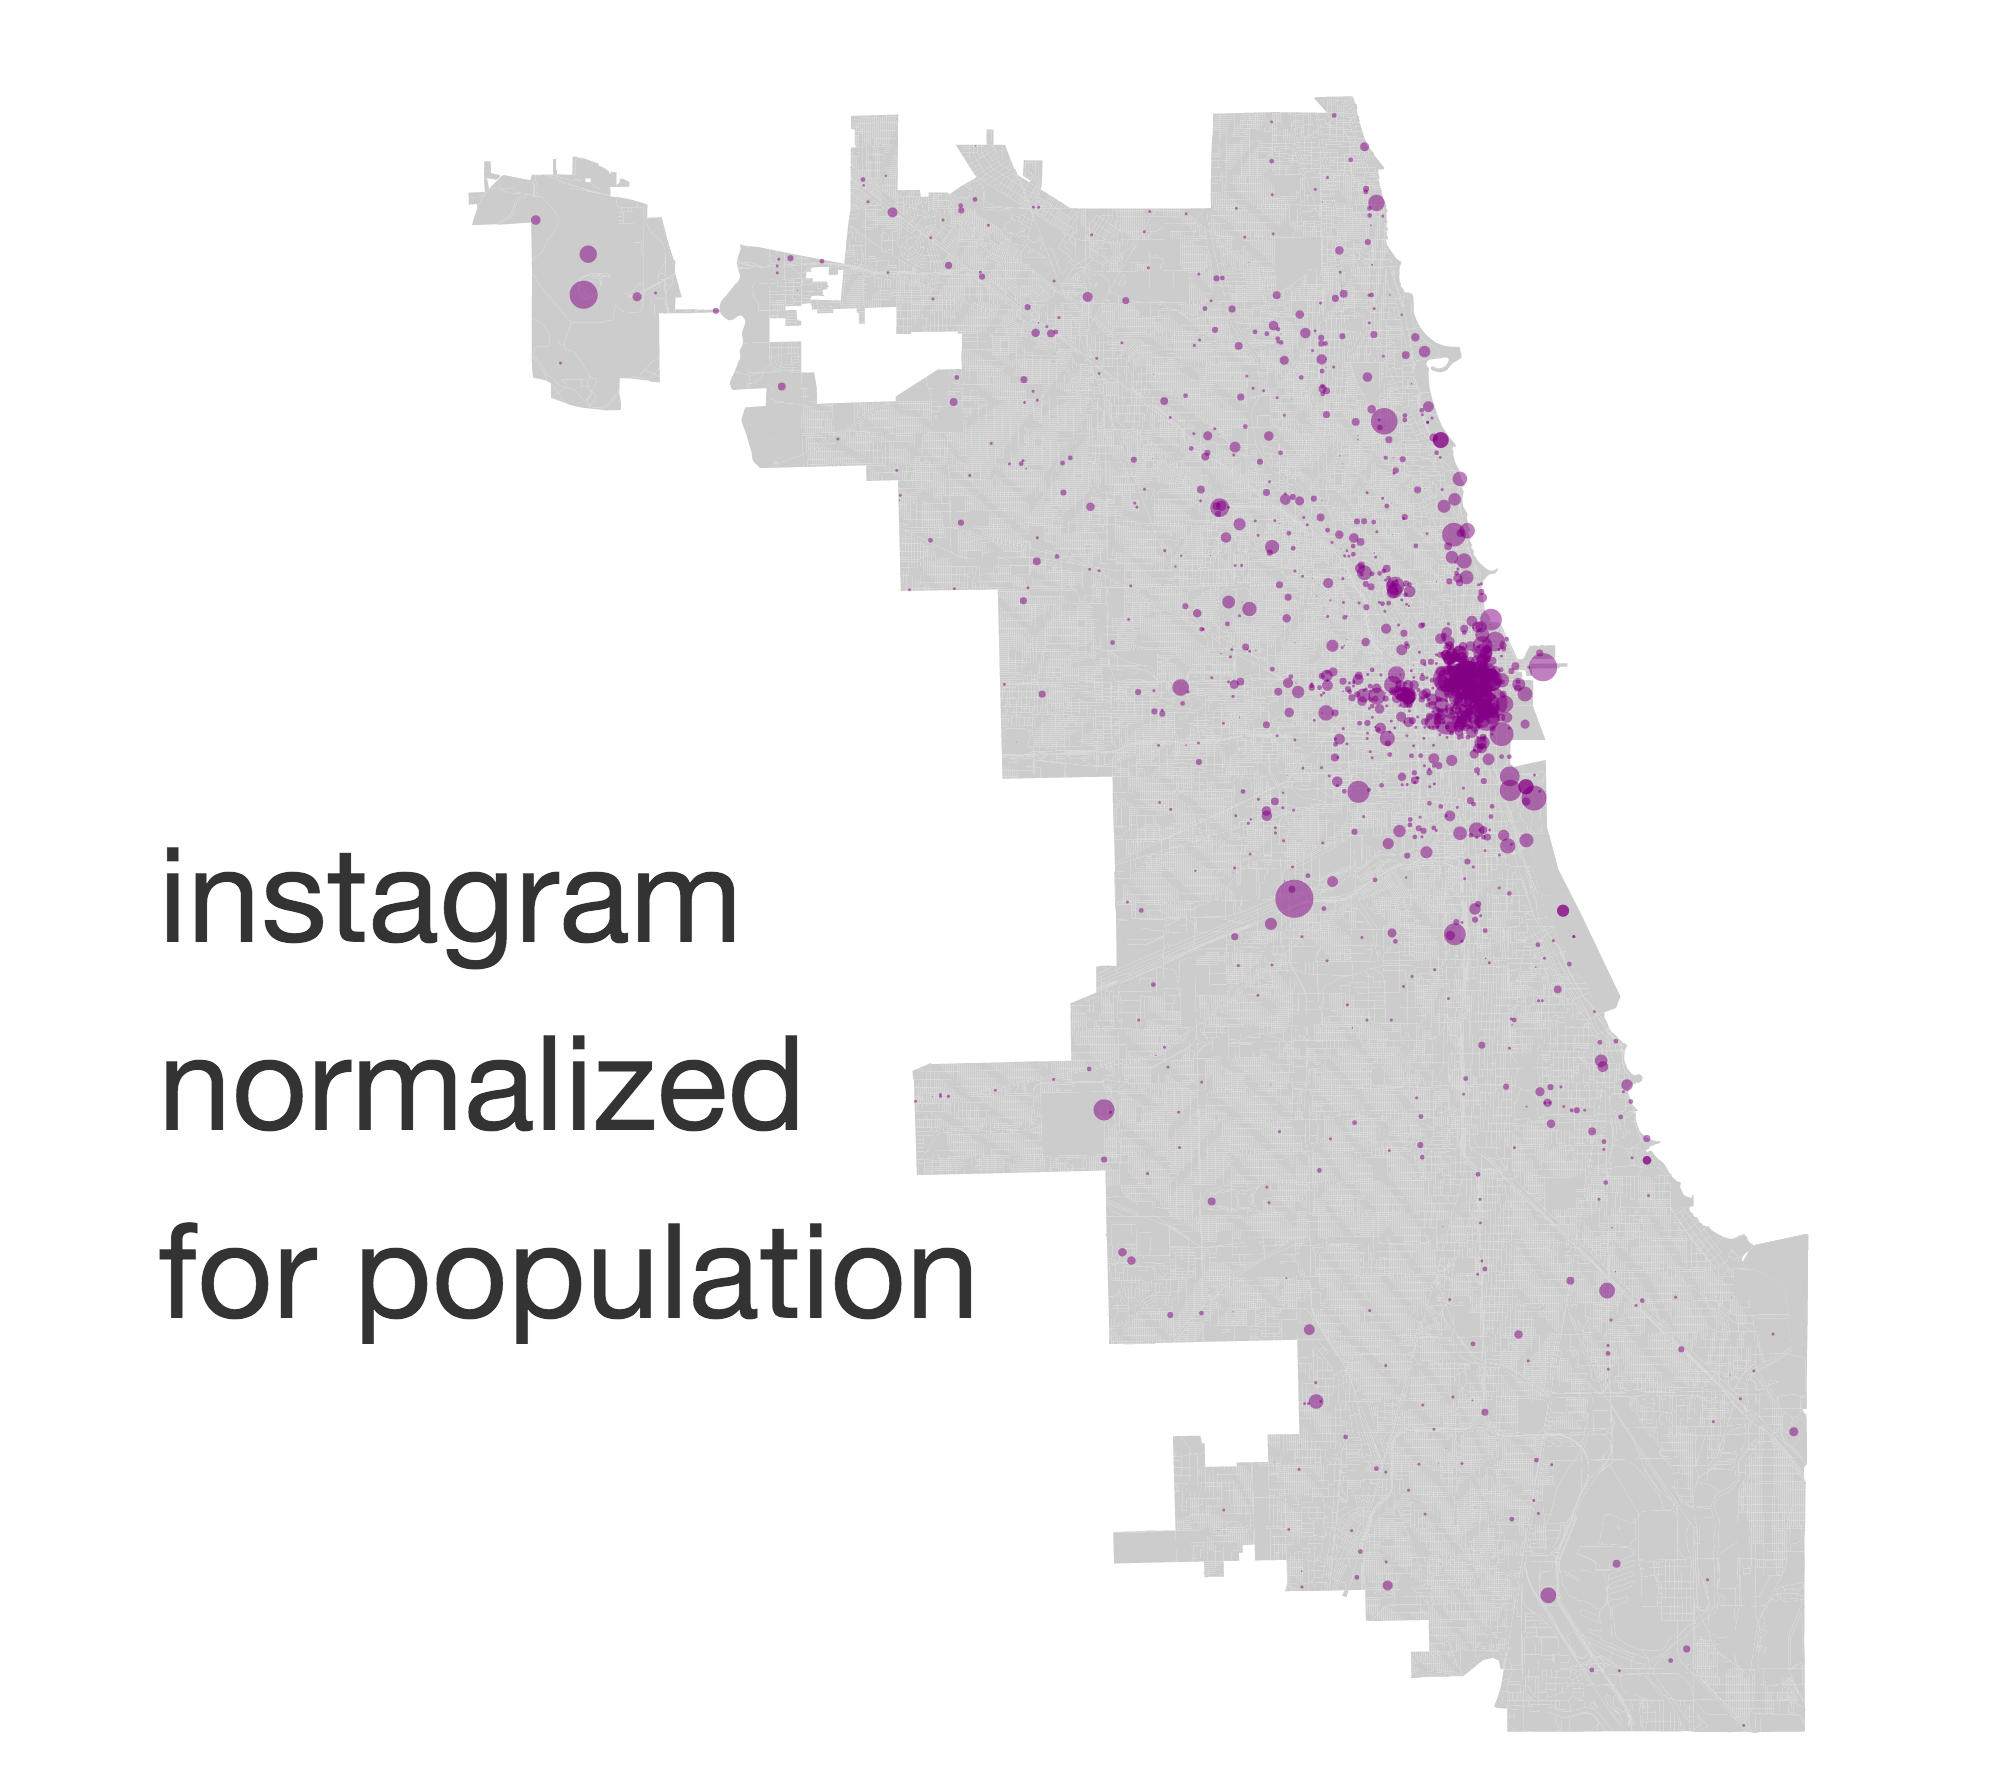
Poof! We’ve stripped out some of the noise. Now we can see that it’s not only Chicago’s population density that drives the north-side’s dominance of the city’s Instagram presence.
Let’s see what areas are over- and under- represented.
Representation Across City Blocks
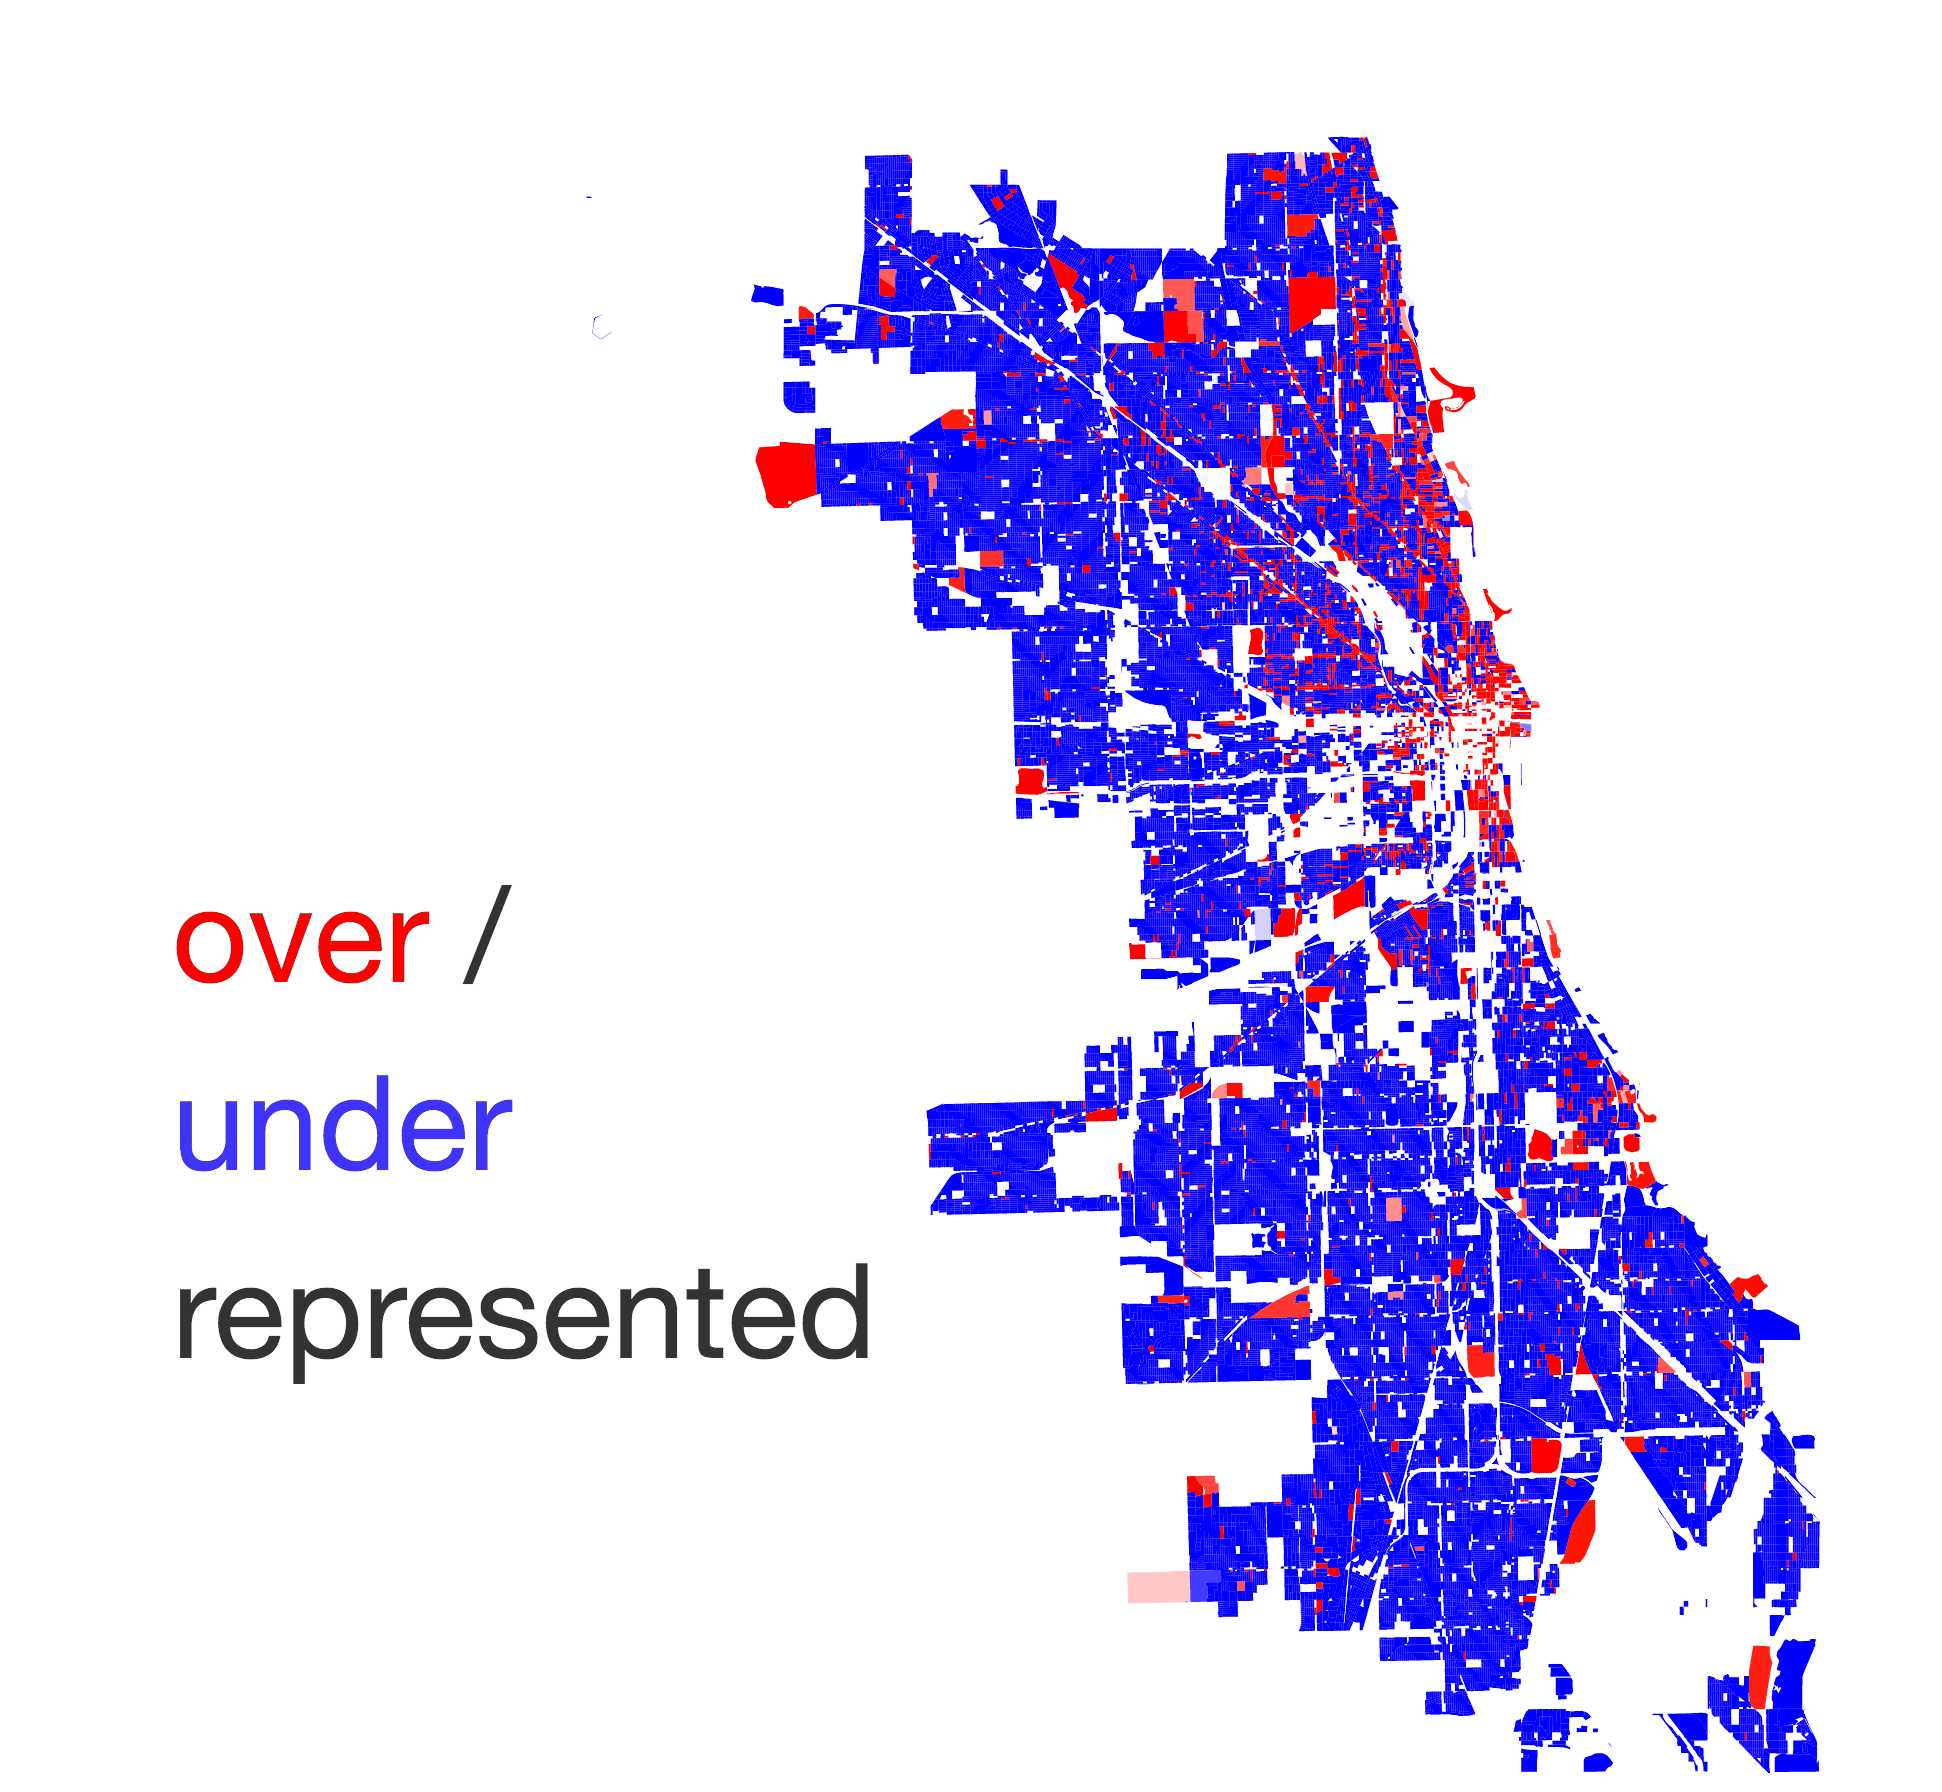
All blocks in Chicago are clearly NOT created equal in terms of Instagram presence. In fact, most of the city is underrepresented.[3] The overrepresented blocks are clustered near the city center (i.e., the Loop, an area of low population density but a high number of daytime workers and tourists) and north-side blocks near the lake and the transit lines.
NEXT STEP: Let’s look at Chicago’s racial/ethnic demographic by mapping census data.
Racial Demographics Mapped to City Blocks
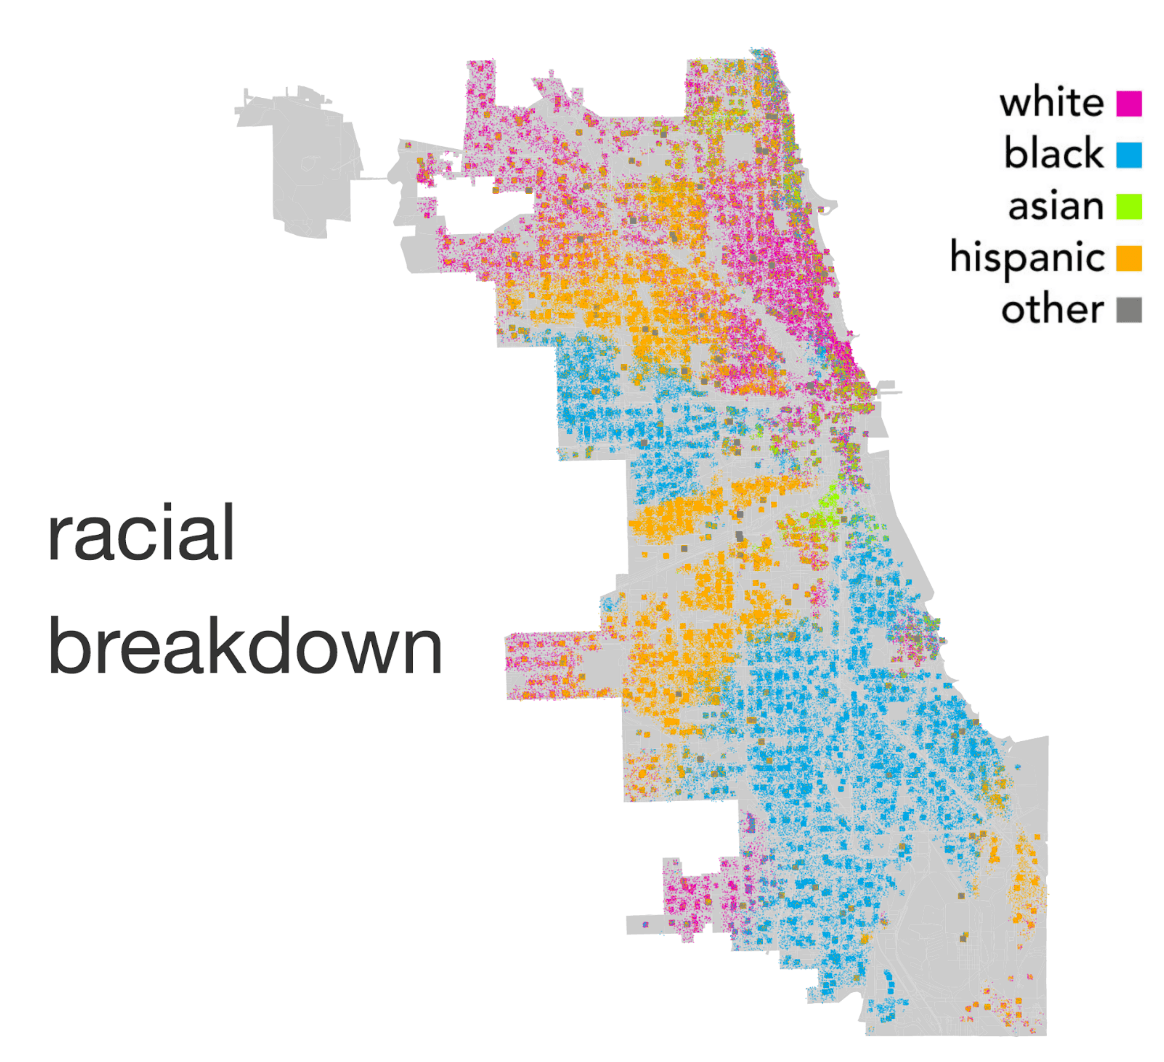
When we map racial demographics to city blocks[4], we can see at even a cursory glance that race is far from equally distributed in Chicago. This revelation, though not groundbreaking, has troubling implications when considering the earlier map of Instagram data-which now appears to be heavily biased towards white populations in the north of the city.
NEXT STEP: Let’s see how race is represented in Chicago’s Instagram to see who exactly is missing.
Racial Representation in Chicago’s Instagram
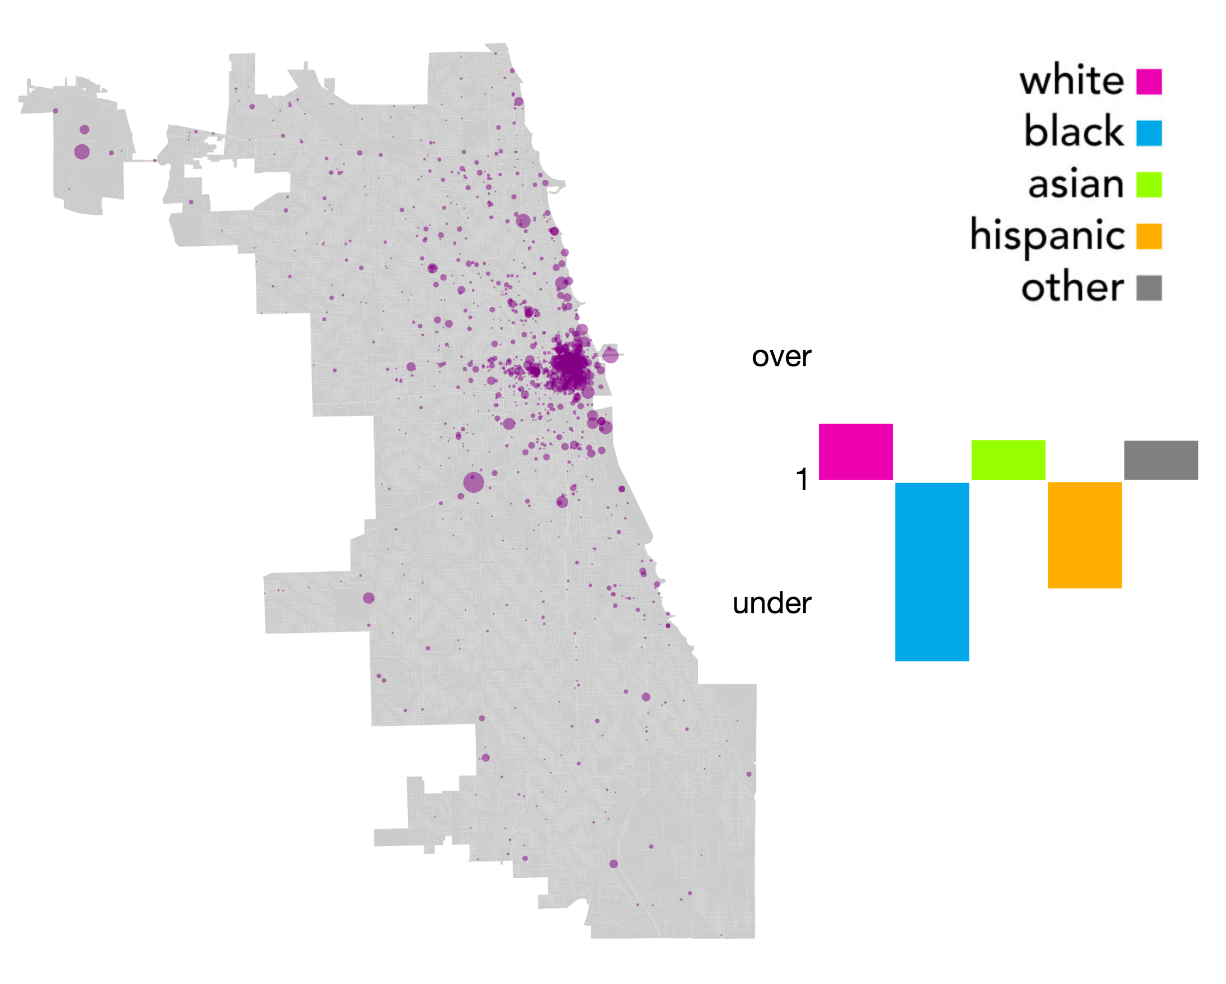
Based on this picture, some populations are clearly underrepresented when their Instagram activity levels are compared to their portion of the Chicago’s population[5]. It would require black populations to more than double (2.44 times) and hispanic populations to almost double (1.86 times) their current Instagram activity in order to match their population numbers (30% and 29% respectively), while white and asian populations are over-represented as compared to their numbers (34% and 5%).
SO, SOUTHSIDERS JUST DON’T USE INSTAGRAM?
Maybe, but maybe not. We can’t tell. Truthfully, it’s hard to make any claims at this stage because we only see where Instagram activity is concentrated, not why it’s concentrated there. Something that adds complication to the interpretability of this data and these observations is that it all relies on what is publically available. It is quite possible that there are several contributing factors to the final picture that gets painted by the results. For instance, tourists might be overwhelming the dataset and their movements bias the picture away from areas that are predominantly black or hispanic. Conversely, populations which have been historically victims of police harassment and abuses of authority may have a greater tendency to keep their privacy settings set to prevent public sharing of their data. To add to haze, another complication is that all populations may tend to take pictures in certain areas (e.g., trendy/tourist spots) and “the who” in the equation is further occluded by “the where”. At this stage, more research is needed into why the north dominates Chicago’s Instagram. It’s important to note, however, that any study based on this data faces these exact same limitations. If they are not made explicit, it is easy to reach wrong conclusions by forgetting about this bias.
But does this even matter?
YES, IT MATTERS… OR AT LEAST IT CAN
It really depends on the questions we ask and the ultimate users / interpreters of our output. Exploring social media is far from a fruitless endeavour as it can provide researchers with rapid access to information mapped to space and time. There are opportunities for more fine-grained and up-to-date glimpses into dynamic network analyses and to provide rapid emergency relief efforts. But, as these contributions increasingly influence public policy (e.g. law enforcement allocation and reducing demand on public services) we have to remember their inherent limitations before we start acting on the latest Instagram insights. Imagine, for instance, if intervention programs were put in place to combat youth drinking based around the behavior patterns of only a subset of Chicagoans. Would the best practices based on the network dynamics of white teens lake-side be generalizable to all youth? Or would the particular characteristics of different subcultures and status hierarchies limit its reach?
SIDE NOTE: This is not to say that every analysis is fraught with problems. For instance the following are probably not limited by the geographical bias I just highlighted: cats of instagram, exploring a specific congressman’s misuse of public funds, color analysis of brand, predicting next season’s runway models.
CALL TO ACTION
This analysis reveals only a sliver of the truth. A more thorough investigation may reveal other biases that we do not immediately think of when interpreting social media studies. I’d love to see a more nuanced dive into Chicago as well as the richer context of our collective social media landscape. (In particular, it would be interesting to see if there are platforms or cities that invert the patterns that are observed in Chicago!)
Expose YOUR city’s social media blindspots!
Run similar analyses:
-
Look at race/ethnicity or other demographics such as socio-economic status, age, and education.
-
Look at Instagram and/or other social media platforms (e.g., Twitter, Snapchat, Tindr, PokemonGo).
-
Look at longer periods of time to filter for tourist / seasonal impacts.
SPECIAL THANKS:
For making collection of Insta data possible: Instagram API, Charles Proxy, Google GCE, Cron
For allowing for speedy geospatial data mapping: fiona, shapely, RTree (spatial indices!!!)
For guidance into weighting representation: Applied Survey Methods
For demystifying the census: Chicago’s own Joe Germuska for his stackoverflow & Github repo
For inspiration on how to visualize population data: RacialDotMap, RadicalCartography