Gotta Catch‘em all!
Imagine you decide to collect baseball cards, and there are 50 cards in a complete set. Let’s imagine that these baseball cards are sold in individual sealed packs (one card per pack), and that the supply of packs is practically infinite and thoroughly shuffled so that there is an equal, random, chance of any card being in any pack selected.
Question: What is the expected number of packs you’d need to purchase in order to get a full set?
| |These type of problems are given the name “card collector” problems by mathematicians.|
A naïve answer would be 50 packs, but we can quickly see this is not correct. Initially, cards we’d obtain would probably be distinct. However, as our collection matured we’d have an increasingly higher percentage chance of obtaining a card we already had. The last couple of cards could take quite a long time to obtain. The answer is going to be quite a bit more than 50, but how much more? How would the answer change if a complete set of cards comprised 40 cards, or 60 cards?
|You can experiment with the concept on a smaller scale with a set of playing cards. Shuffle the deck, then deal the cards out face up, one at a time. How many cards will you expect to deal before you’ve seen one card of every suit? Clearly, the minimum is four, but how many does it take on average? (OK, strictly speaking this is not quite the same thing because dealing cards this way is not with replacement. To be analogous, you’d need to deal a card, note the suit, and then put it back in the deck, shuffle, and then deal another card).| |
|
|
| |There’s lots of other manifestations of this problem: What is the expected number of HappyMeals™ would you need to purchase in order to get a complete set of toys (for your kids) if there are six toys in a set? How many boxes of breakfast cereal should you plan on purchasing to expect you’ll get a complete set of the five distinct gifts sequestered inside them as this season’s promotion?|
Thoughts
There’s some thinking we can do about this problem before getting into the math. The first point is that, whilst we’re looking for an expected answer (how many cards, on average, it would take to complete the set if were to repeat the exercise an infinite number of times), there’s a chance we’ll never get a set; this chance gets smaller and smaller (to essentially nothing) as we draw more cards, but we could, theoretically, forever be unlucky.
The second point is that the first card we draw has to be distinct (it’s the first card in our collection, and there is nothing for it to duplicate against). There’s a good chance the second card we draw will also be unique (we’d have to be unlucky to draw a duplicate of the first card, especially when there are 50 distinct cards), similarly, on drawing a third card, and a fourth … However, as our collection fills in, we’re increasing our chances of collisions and there’s an inflection point at which it’s more likely that a new card will be a duplicate rather than an unseen card.
Towards the end of the puzzle we can see that, when we’re close to a set, the last couple of cards are going to be brutal to fill in. When we already have 49 cards in the set of 50, on average, we’d need to go through an expected 50 cards before we found that magic one card that we need. When we have 48 cards in the set, you can see that only two cards will make us happy …
These thoughts hint at the mathematical solution to the problem.
Math
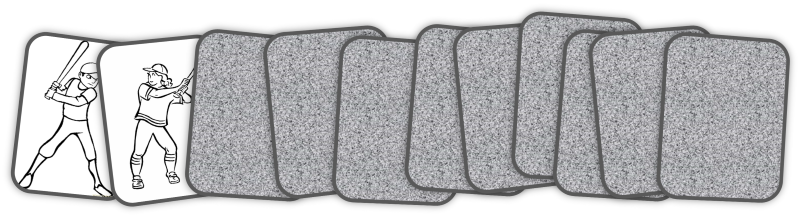
Here’s an example generic time-series sequence showing possible cards drawn towards getting our 50 card set. The cards are numbered based on the their first distinct appearance. The first card, by definition, is unique, and so is labeled #1. The next card could be the same as the first card, in which case we’d also label it #1. In this case, however, imagine it is different, and since this is the first time we’ve seen this card, we’ll mark it #2. Then we see the first card again, then two occurences of the same new card #3, followed by the first occurence of card #4 …

The sequence continues, each time either adding a new number (if it is the first time this card is seen), or representing the card with the number of the card the first time it was seen.
The sequence will terminate the first time we see the fiftieth distinct card, and so will end with #50. If we can calculate the average length of this sequence, we can determine the average number of cards we’d expect to have to purchase.
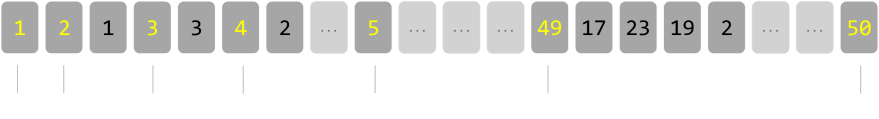
In the diagram above, the first occurence of each distinct card is show in yellow. We’ll also define a distance Cn, which is the number of cards between occurence n and n-1
The first card we turn over has to be unique, so only takes us one card. C1 = 1 To get to the second unique card, how many cards, on average will this take us? Well there are 50 cards in the collection, and only one we don’t want, so any one of the (50-1) = 49 cards will do. The expected number of cards drawn is therefore C2 = 50/(50-1) = 50/49 For the average distance between the second and third cards, the expected number of cards is C3 = 50/(50-2) = 50/48 Generically, if there are N cards in the total set (in our case N=50), then Ck = N/(N-[k-1])
The total expected number of cards to be drawn to get a complere set is the sum of all the individual gaps that are need between each distinct new first occurences of a card as seen above.

The formula for the expected number of cards to be drawn is the inverse of the ratio of unseen cards left over the total number of cards. When we are trying to draw the kth card in the set, we know there are still N possible choices of cards we can get, but only (N-[k-1]) will be cards we have not seen before.
This sumation simplifies nicely to be the above answer. Plugging in the values for N=50, we get the answer of approx 224.96

So, the expected number of cards we’d need to get rounds to 225. In the playing card example (N=4), the answer is a suprising 8.3 cards (which we’d round up to nine). If there are six toys in HappyMeal set, you’d have to average 15 meals to get a complete set. Here is a table of the first few results: |N=1|1.00| |N=2|3.00| |N=3|5.50| |N=4|8.33| |N=5|11.42| |N=6|14.70| |N=7|18.15| |N=8|21.74| |N=9|25.46| |N=10|29.29| |N=11|33.22| |N=12|37.24| |N=13|41.34| |N=14|45.52| |N=15|49.77| |N=16|54.09| |N=17|58.47| |N=18|62.91| |N=19|67.41| |N=20|71.95| |N=21|76.55| |N=22|81.20| |N=23|85.89| |N=24|90.62| |N=25|95.40| |N=26|100.21| |N=27|105.07| |N=28|109.96| |N=29|114.89| |N=30|119.85| |N=31|124.84| |N=32|129.87| |N=33|134.93| |N=34|140.02| |N=35|145.14| |N=36|150.28| |N=37|155.46| |N=38|160.66| |N=39|165.89| |N=40|171.14| |N=41|176.42| |N=42|181.72| |N=43|187.05| |N=44|192.40| |N=45|197.77| |N=46|203.17| |N=47|208.58| |N=48|214.02| |N=49|219.48| |N=50|224.96|
The expected number of cards to be drawn to get at least one of every card in a set of 50 baseball cards is 225.
Harmonic Numbers
If you are familiar with mathematics you might recognize the sum of the first-n reciprocals by the more common term of Harmonic numbers. I’ve written a little bit about harmonic numbers in the past in the post How hungover can you get? (about creating towers of blocks to overhang a table), and in the Prisoner Escape puzzle.

As the number of terms gets larger, the harmonic series can be approximated to the natural log of the number of terms (plus the Euler-Mascheroni constant, γ, which represents the difference between the smooth log curve and the stepped quantized reciprocal sums).
|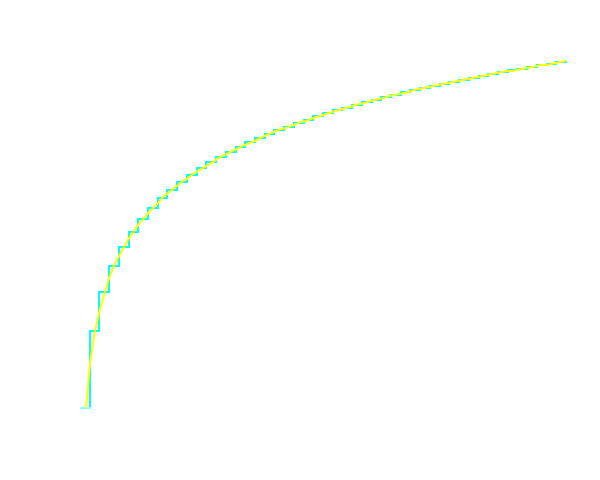 |We can see from this that the a Harmonic number grows without limit (albeit increasingly slowly), very close to the natural log curve. If our collection size is large, an approximation for the size of draws is n ln(n).The graph on the left plots the curve of γ+ln(n) in yellow, and the cummulative sum of 1/n in cyan.This makes sense; Harmonic numbers grow with no limit in just the same way that, if we keep increasing the number of cards in a set, we’d expect to have to draw more cards to complete that set!|
The graph on the left plots the curve of γ+ln(n) in yellow, and the cummulative sum of 1/n in cyan.
Distribution of drawings
We’ve calculated the expected number of cards to be drawn, which is a fancy way of saying the average (arithmetic mean) over an infinite numer of trials. The simple way to think about this is that if we repeated this collection exercise a million times, we’d expect to have to draw 224.96 million cards, but what is the distribution of these number of drawings?
Below is chart I generated by running a simulation a few hundred million times. Within the limits of the random number generator you can see the curve.
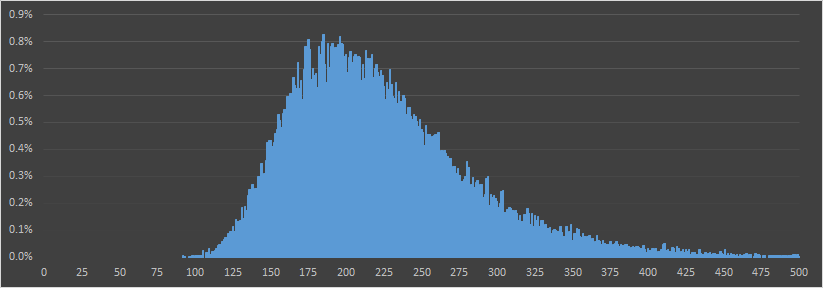
The x-axis shows the number of cards that needed to be drawn to complete the set of 50.
The y-axis shows what percentage of the results took this number of draws.
The first thing to note is that, whilst it is theoretical to complete a set in 50 draws, I never experienced this (in fact, in my simulation, the smallest number of cards to succesfully get a complete set was in the low 90’s). The next thing to note is that the peak of this graph is lower than what we know to be the average (which I also verified using the simulation).
The peak of the graph gives the MODAL answer to this question, which is “What is the most likely number of cards you’ll have drawn after you have drawn a complete set?” This is lower than the MEAN because we can see the long tail of the graph to the right; if we are unlucky and end up drawing a lot of cards these extra cards push the average out.
The other average that statisticians like to talk about is the MEDIAN, we can find this by plotting the data on a cummulative graph (shown below). The median occurs at the 50% cummulative level. The median is a very nice data point to talk about. In this case, it is 214 cards. “As many people will have drawn less than 214 cards, as will have drawn more than 214 cards, when they completed their sets”.
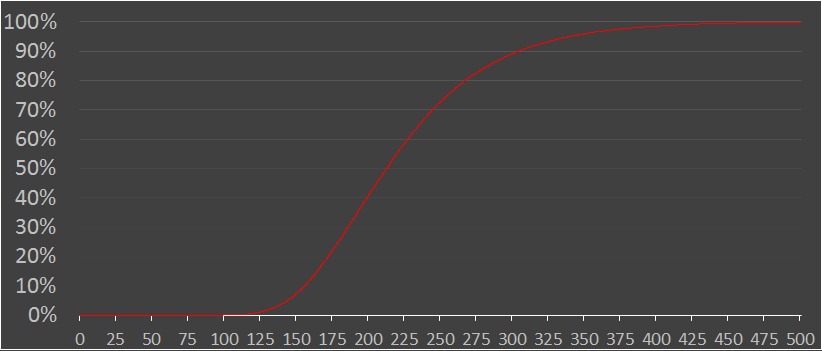
From the cummulative graph we can work out other statistics too like 5% of people will need to drawn more than 342 cards to complete their sets (and the complement that 95% of people will draw less than 342), and that a lucky 6.8% of the people drawing will need less than 150 cards to make the set.
Optimization - Can you do better?
So, if you want to collect cards, what’s the best strategy? There’s one simple answer: Trading.
With trading, you can exchange cards with other collectors. Cards that you have many duplicates off, your friends might be missing. Similarly, the cards that you need, your friends might have plenty.
| |The math is more involved, but there is a lot of research into the expected number of draws needed to make m sets of collections of n items. It’s not linear, and it gets easier with larger m.|
Non-equal probabilities
All the above calculations relied on the assumption that every baseball card was printed with equal frequency, the cards were thorough shuffled, and that each card has an equal likelihood of being in each pack. What happens if this is not the case? What happens if the (evil) baseball card printers made some cards harder to obtain? How would we calculate these odds?
There are two ways to address this situation:
The first is to run a Monte-Carlo simulation. This might sound like a cheat, but it’s a legitimate way to get answers fast. Computers are very good at running billions of repetitive calculations. If you know the probability distribution for the cards (or even an estimate based on some sampling), you can use this, and a random number generator, to simulate the exercise a large number of times, and averaging the results. If you want a more formal answer, it’s time to dig out some Markov Chain analysis and do a little matrix multiplication. If you want more details on this, you might like the analysis I did on the kids game of Snakes and Ladders, or the percentage change of rolling an Yahtzee.
You can find a complete list of all the articles here. Click here to receive email alerts on new articles.